
Recommended Procedures to Assess Critical State Locus from Triaxial Tests in Cohesionless Remoulded Samples


CONSTRUCT-GEO, Faculdade de Engenharia da Universidade do Porto (FEUP), Rua Dr. Roberto Frias s/n, 4200-465 Porto, Portugal
*
Author to whom correspondence should be addressed.
Geotechnics 2021, 1(1), 95-127; https://doi.org/10.3390/geotechnics1010006
Submission received: 15 June 2021
/
Revised: 21 July 2021
/
Accepted: 23 July 2021
/
Published: 29 July 2021
(This article belongs to the Special Issue Fundamental Challenges for Civil Infrastructures in Problematic and Unsaturated Soils, Breakthroughs, and Opportunities)
Abstract
:The critical state theory is a robust conceptual framework for the characterisation of soil behaviour. In the laboratory, triaxial tests are used to assess the critical state locus. In the last decades, the equipment and testing procedures for soil characterisation, within the critical state framework, have advanced to obtain accurate and reliable results. This review paper summarises and describes a series of recommended laboratory procedures to assess the critical state locus in cohesionless soils. For this purpose, results obtained in the laboratory from different cohesionless soils and triaxial equipment configurations are compiled, analysed and discussed in detail. The procedures presented in this paper reinforce the use of triaxial cells with lubricated end platens and an embedded connection piston into the top-cap, together with the verification of the full saturation condition and the measurement end-of-test water content—preferable using the soil freezing technique. The experimental evidence and comparison between equipment configurations provide relevant insights about the laboratory procedures for obtaining a reliable characterisation of the critical state locus of cohesionless geomaterials. All the procedures recommended herein can be easily implemented in academic and commercial geotechnical laboratories.
1. Introduction
Critical state soil mechanics (CSSM) has been successfully applied to describe the behaviour of geomaterials. For this reason, it is the basis of several constitutive models, such as Cam-Clay [1] and NorSand [2]. The critical state locus (CSL) is independent of its initial fabric, stress state and void ratio. The essential characteristics of the CSL are: (i) stable frictional state in a homogeneous granular body, in which the particles move with each other without changing the volume of the soil; (ii) uniqueness and linearity for each material as long as its dimension, morphology and particle roughness are preserved; and (iii) stable effective stresses. Hence, the CSL is the condition in which the soil deforms under constant volume and stable mean effective stress. The CSL is widely applied for flow liquefaction assessment [3,4,5], stress-dilatancy analyses [6,7,8] and characterisation of mine tailings [9,10,11,12]. The conventional triaxial test is commonly used for determining the CSL in the three-dimensional invariant space of shear-confinement-volume state, that is, a representation in the space. Nevertheless, for convenience, CSL can be expressed in terms of its 2D projection on the space in terms of the strength parameter M and its 2D projection on the space in terms of the critical state parameters slope and intercept . Therefore, to define CSL, an accurate measurement of the applied load, volume changes and shear-induced pore pressure must be done during testing, mainly during shearing.
This review paper aims at summarising and describing a series of recommended laboratory procedures to assess the CSL in cohesionless soils (e.g., sands and non-plastic silty tailings). Therefore, details regarding the sample preparation (for remoulding loose specimens of cohesionless), improvements in the triaxial equipment and testing methods are reviewed in detail. In addition, different experimental techniques and current configurations of triaxial equipment are compiled to discuss their main advantages and limitations for characterising the soil behaviour at the critical state condition. Such improvements cover the implementation of oversized lubricated end platens [13] and an embedded top-cap loading ram connection [14,15]. However, the procedures presented herein do not address the assessment of small-strain stiffness using advanced and high precision systems, such as the local instrumentation [16], high-resolution fibre optic sensing technology [17,18], image analysis [19,20] and computerised tomography scan [21,22], since the critical state of soils occurs at large deformations.
On the other hand, experimental data and CSL parameters reported in the literature of different cohesionless soils (with distinct origins and morphology) were used to compare the reliability and reproducibility of laboratory soil testing procedures. Comparisons between different triaxial equipment configurations confirmed that the lubricated end platens reduce the mobilised friction during undrained tests, providing a better definition of the instability point of soils. The analyses of this review paper showed that the use of an embedded connection piston avoids the tilting of samples, resulting in a uniform shearing without the generation of shear bands during triaxial testing in contractile soils and inducing higher compressibility. On the other hand, the use of end-of-test soil freezing, EOTSF, (originally proposed by Sladen and Handford [23]) demonstrated that the application this method led to reliable measurements of the specimen volume after testing. The above allows obtaining reliable results of the CSL when the soil is fully saturated. The procedures described in this paper provides guidance and relevant insights to researchers and practitioners attempting to accurately define the CSL of cohesionless geomaterials in the laboratory.
2. Factors Affecting the Reliability of CSL
2.1. Evolution of the Grain Size Distribution—Crushing
During consolidation or shear phases, the grain size distribution (GSD) of soil may evolve due to particle breakage or crushing. Crushing increases the fines content and induces changes in the particle shape. The increment of fines content causes additional compressibility and shifts down the CSL position [3,24], while changes of particle shape adjust the critical state parameters M, and [25]. Such effects generate uncertainties on the position of CSL. However, to obtain reliable results, a stable GSD is expected along the test path for reaching the CSL [26].
One-dimensional compression testing may help to identify the crushing stress threshold of soils. Nevertheless, the assessment of CSL must be done under representative conditions, that is, the likely stress state on the field. Bandini and Coop [27], Ghafghazi et al. [24] and Yu [28] reported an identifiable change in CSL slope associated with crushing for a range of stresses between 700 and 1000 kPa. Therefore, for tests conducted at these stresses, grain size analyses must be carried out after testing to confirm changes in the GSD of soil and then validate the representability of CSL. Additionally, in some cases, complementary analyses to evaluate the evolution of particle morphology are necessary to identify additional factors affecting the reliability of CSL.
2.2. Transitional Soil Behaviour
Transitional soil behaviour is characterised by non-unique CSL, their locations being highly dependent on the initial void ratio (). Mixed grading and structured soils are the most susceptible to developing transitional soil behaviour [29,30,31,32,33,34]. These particular soils have characteristics, including the evolution of GSD during testing, which results in different tests paths that do not tend to a unique CSL, as with conventional soils—this is not consistent with the CSSM framework. The multiple CSL of transitional soil space are parallel but have a different position, that is, the same or very similar and numerous for all the . Figure 1 schematically illustrates the CSL of transitional soils compared against the CSL of a conventional soil. Transitional soil behaviour can be easily identified by assessing the convergence of the normal consolidation line (NCL) through one-dimensional consolidation tests in soil samples with different [35].
2.3. Non-Linearity of CSL
The CSSM framework states that the CSL corresponds to a straight line in both and spaces. However, several authors [36,37] recognise that in granular materials, a curve, with the form of the power-law , provides the best fit to represent the CSL in the space. The curvature of CSL is mainly related to flow instabilities and the crushing of soils or evolution of the morphology of the particles [5,10,38], which are induced at low and higher stress states, respectively, as shown in the schematic diagram of Figure 2.
Figure 2 shows that at low stresses, the CSL becomes non-linear, tending to be flatter. The above is a consequence of flow instabilities, which in many cases lead to soil liquefaction in contractive materials under undrained conditions but also—and eventually more important—to uncertainties in soil testing under low stresses [10,39,40]. For some authors [41,42], flow instabilities are due to a loss of stiffness and strength of soils, which are characterised by effective stress close to zero. However, in some cases, these differences are because of compliance issues during testing—that is, the use of unappropriated transducers for specific strain and stress levels that may induce significant errors in the test results. On the other hand, at high stresses, the CSL becomes non-linear and increases its slope because of grain changes (e.g., crushing or particle morphology evolution), as explained before. Therefore, the phenomena and non-linearity effects are independent of the CSL, but they can be analysed and interpreted using the CSSM framework.
3. Triaxial Apparatus Improvements for CSL Assessment
3.1. Oversized Lubricated End Platens
The oversized end platens were introduced by Rowe and Barden [13]. The use of oversized lubricated end platens reduces the stress concentration due to the friction between the soil specimen and the platen restraint to negligible amounts [7,40,43]. This reduction yields a uniform stress–strain behaviour and a reliable volume change or pore pressure response, as observed by Baldi et al. [14]. The lubricating ends prevent soil particles from being pressed through the sheets and develop frictional contacts with the end platens [44]. Note that the friction between end platens and soil cannot be completely eliminated, even by implementing oversized lubricated end platens. Lam and Tatsuoka [45] conducted a series of direct shear test to assess the friction between the lubricated end platens with soil particles using fine to medium sands, finding friction angles smaller than 0.25°. These values are in accordance with observations reported by Kolymbas and Wu [46]. An additional advantage of using oversized lubricated platens is the improvement in loose to medium soils that the methods used to perform the cross-sectional area correction required to calculate the deviatoric stress provide (q). The above assumes that the specimen deforms as a right circular cylinder (RCC) to be more reliable until high deformations of the specimens—usually necessary for the defamation at the critical state.
The lubricated end platens comprise a very stiff and smooth platen and two discs of standard triaxial latex membrane. Moreover, this includes a pair of thin layers of silicone grease between the two latex discs and the surface platen. The silicone grease must be carefully applied to avoid interference with the sample drainage. Figure 3 shows the configuration of the oversized lubricated end platens.
On the other hand, an oversized platen corresponds to a configuration in which the diameter of the platen is bigger than the sample diameter (see Figure 3b). The oversized platens aim at ensuring the full support of the sample during shear, as in that phase, the specimen may expand its volume radially, avoiding any overhang and allowing uniform radial strains in all samples. In tests without oversized lubricated end platens, most of the axial strain and volume change occur at the middle portion of the specimen—whose values are both lower than the actual ones at the middle part—resulting a more uniform volume change [47]. Therefore, the oversized lubricated end platens allow the soil specimen to deform as an almost perfect cylinder during shearing, causing uniform strains and stresses that ensure the measurement of the conceptually consistent soil behaviour in the large strains range (e.g., more than 15%). Figure 4 shows the differences between the deformations at the end of shearing in triaxial cells with and without oversized lubricated end platens.
There are no specific studies indicating the effect of an oversized configuration on soil behaviour during triaxial shearing [48]. However, to guarantee the correct operation of the lubricated end platens, porous stone with the same diameter as the platens cannot be used in triaxial testing to assess the CSL. Note that small porous stones may affect the saturation process and drainage of the soil specimen, mainly in geomaterials such as silts or mixed grading soils with high fines content (e.g., mine tailings). Therefore, an adequate proportion between the porous stone and the lubricated stone provides uniform strains and ensures the correct drainage of the soil, in terms of flow rate. Figure 3a presents an optimal proportion between the lubricated and non-lubricated area, where mm, mm and mm.
The authors established the optimal proportion between the lubricated and non-lubricated areas based on the practical experience achieved in the geotechnical laboratory of the University of Porto (UPorto) during a series of joint works with Golder Associates—Portugal—regarding the characterisation of cohesionless soils (including sandy and silty-sized tailings). Such a proportion was later outlined and reported by Jefferies and Been [7], demonstrating its applicability for assessing the CSL of sands, silts and tailings. As these authors stated, such a configuration guarantees the water flow during all testing phases (i.e., percolation, saturation, consolidation and shearing) and allows a uniform radial deformation at the ends of the soil specimen. However, it does not allow for measuring of the coefficient of consolidation and the hydraulic conductivity during testing since the central porous disc modified the flow boundaries.
On the other hand, it is necessary to consider that the porous stone may be clogged due to the accumulation of fine soil particles or the transfer of silicon grease, which is waterproof. Therefore, the porous stone must be regularly checked and replaced if needed. The use of filter paper (see Figure 3b) reduces the accumulation of fine soil particles into the porous stone. The filter paper ideally should have a diameter slightly larger than the porous stone, that is, large enough to cover the porous stone but with a minimum coverage of the lubricated area.
3.2. Top-Cap Loading Ram Connection
One of the most serious errors during triaxial testing is due to the misalignment between the triaxial cell and the soil specimen. The sources of this misalignment can be tracked to the sample but also to the triaxial apparatus. Figure 5 illustrates some possible alignments between the loading ram piston and the specimen axis during triaxial testing. This misalignment will result in a non-perpendicular and eccentric loading, and as a consequence, the sample will produce non-uniform deformations and stresses during shearing. These uncertainties in the characterisation of the stress–strain response of the soil will affect the reliability of the CSL definition.
Different alternatives to correctly apply the axial load during triaxial testing have been proposed in recent decades (e.g., [14,49]). The first alternative allowed for direct and uniform contact during the beginning of shearing, providing accurate measurements of the small-strain stiffness of soil. Pistons with flat plates were preferred to spherical caps, as they would ensure the verticality of the loading. Moreover, in natural soils with heterogeneous fabrics—such as residual soils from granite—the horizontality of the top end platen must be guaranteed [50]. This permanent contact can be ensured with a flat piston with small spherical caps inside, as illustrated in Figure 6. The use of such a configuration avoids the inclination of the top platen during triaxial testing.
Another alternative to minimise the misalignment between the loading ram piston and the specimen axis is to connect to the load cell and the top platen through a suction cap before starting the consolidation phase. Figure 7 illustrates the suction top cap. The conical extension—that is, screwed into the load cell—will enter into contact with the suction cap, holding a sort of water cushion trapped between them. The drainage tube connected conical extension allows for the removal of the water, while full contact is not achieved. Such a tube is attached to an external pump until all the water is sucked away and a vacuum is created between the suction cap and the conical extension.
However, this connection must be executed very slowly and carefully to avoid any sample disturbance. This aspect is especially critical in low confined and sensitive soils, as the contact can induce volumetric strains or pore-water pressure that are not associated with any particularly triaxial stage. In the worst-case, the soil sample can trigger liquefaction due to excess of induced pore-water pressure in undrained conditions generated during the contact of the soil sample with the top cap. Previous tests using this top-cap ram connection also presented another complication. In very loose samples, the collapse during the flushing can be quite substantial and can induce a tilting of the sample, resulting in a very challenging top-ram connection. In addition, this method would require the adaptation of the triaxial cell to include a top drainage tube.
The use of an embedded top-cap guided ram connection in the triaxial apparatus will transcend all the adversities mentioned above. This improvement was introduced by Hettler and Vardoulakis [49] to reduce the load eccentricities during triaxial shearing. Years after, Baldi et al. [14] showed the benefits of using such a system in the symposium on Advanced Triaxial Testing of Soil and Rocks sponsored by ASTM. Based on these findings, the Geotechnical Laboratory of the University of Porto (UPorto), with the collaboration of Golder Associates Portugal, developed and adapted the system illustrated in Figure 8.
The top-cap loading ram connection proposed by UPorto presents three main features that will guarantee its effectiveness: (i) there is no actual fixed connection between the loading ram and the top cap, eliminating compliance errors and adjustments associated with the connection process; (ii) the top platen is made from a resistant acrylic plastic, a lighter weight material that will reduce the collapse of very loose samples during flushing; and (iii) the top platen is trimmed, which will accommodate the embedded piston, significantly reducing the ‘tilting’ of the soil sample and assuring a perfect alignment between the triaxial cell and the soil specimen. Note that the contact between the piston and the top cap is only made at the beginning of the shearing phase (when the tip of the piston touches the bottom of the trimmed top platen). After assembling the triaxial cell, the piston is placed inside the trimmed top platen without loading the sample, allowing the specimen to freely deform during the remaining stages without losing its alignment, as is guided through a groove.
The use of an embedded top-cap loading ram connection guarantees a central and vertical loading, which will produce a uniform sample shearing behaviour and volume changes [48]—factors affecting the reliable assessment of the CSL. An additional feature of the embedded top-cap loading ram connection is the presence of guidelines in the embedded piston, which allow for registering the height changes of the soil specimen before the soil consolidation. In the UPorto design, there are eight guidelines separated by 1.75 mm. The piston dimensions are mm and mm, and the groove in the top cap is of about 18 mm depth by mm.
4. Specimen Preparation Method
Obtaining undisturbed high-quality samples of cohesionless soils is a challenge in geotechnical engineering due to the sample disturbance during sampling and handling procedures, which may affect the mechanical response of the soil. To circumvent these complications, advanced equipment and demanding techniques are mandatory during the sampling process and laboratory testing, which have also been documented by Viana da Fonseca and Pineda [51], Viana da Fonseca et al. [52] and Molina-Gómez et al. [53]. Moreover, the heterogeneity between undisturbed samples or the inherent layering within the specimen can result in a scattered definition of the CSL. Given these limitations, reconstitution methods of specimen preparation take on a significant importance for geomechanical characterisation.
The ideal method of remoulding samples has been an ongoing debate, and many studies and contributions have been presented regarding different approaches [54,55,56,57]. The moist tamping (MT) technique, widely used in the critical state approach, faces criticism as it can produce void ratios looser than the ones on-field and influence the static undrained behaviour of the soil, making it prone to liquefaction due to their metastable honeycomb structure. Water sedimentation (WS) methods and slurry deposition (SD) generally replicate a similar fabric as in situ conditions of natural alluvial and hydraulic fill deposits. However, the samples tend to show a dilative behaviour and some induced anisotropy.
Dense samples are not desirable when defining the CSL, as they may not reach the ultimate state within the strain limitations of the triaxial apparatus, mainly due to the non-uniform sample densities and strains that develop once shear localisation occurs. Further studies would be required, such as a state-dilatancy interpretation, which is not the scope of this work. Dry pluviation (DP) is an effective method of achieving a wide range of target densities in sandy soils once the technique is calibrated [58,59,60]. DP methods result in a more contractive response and enhanced reverse behaviour than wet reconstitution methods [61]. However, DP cannot be applied to every type of soil, such as plastic soils.
The main concern of the method for remoulding specimens is its effect on soil behaviour during testing, which should represent the field conditions. It is well-known that the remoulding method determines the structure or fabric of the soil [62,63]. Nevertheless, the CSL is reached after the initial structure is destroyed, as the sample reaches very different particle arrangement at large strains [10,64,65,66,67,68]. Although its strong influence is small to intermediate in strain level, the existence of induced soil fabric in the laboratory is not relevant in ultimate states [7]. The method for remoulding specimens to assess the CSL aims to produce uniform samples with specific void ratios that represent the material under study. As this paper deals with cohesionless soils (sandy, silty and non-plastic geomaterials) it is considered that the moist tamping technique simultaneously with the undercompaction method is able to produce uniform and reproducible soil specimens with the widest void ratio range, including the soil testing from very loose to loose conditions. The soil specimens remoulded for such conditions tend to show contractile behaviour, which allows for a reliable measurement of the CSL.
4.1. Sample Size
Regarding the variability of parameters such as unit weights, elastic moduli values and shear strength, large-sized specimens tend to accommodate eventual induced non-homogeneous face during the preparation process in comparison to small specimens. Small-sized remoulded specimens are more likely to present significant variations in final void ratio measurements. These variations in void ratio can be attributed to the loss of soil or water during the specimen removal, causing errors in the interpretation of test results. In addition, this may lead to inaccuracies in the estimation of specimen dimensions, such as the diameter, which is a relevant factor for assessing the stress state during triaxial testing due to its relevance on the deviatoric stress computation. Hence, large samples are desirable since both reliable estimations of both e and are crucial for the unbiased definition of the CSL.
In this review, the equipment, schemes and results presented consider tests for soil specimens of 70 mm diameter with an initial height-to-diameter ratio . It is well documented [69,70] that this ratio helps to overcome the effects of end restraint due to friction on the end platens (along with the use of lubricated ends), also allowing for the free development of shear bands by avoiding interception with the end platens.
Some studies recommended to overcome the effects of end restraints due to friction (e.g., [46,71]). However, in dense soils with such a ratio, it is not appropriate due to shear bands developing freely because of their interception with the end platens [44]. This effect occurs in both lubricated and non-lubricated end platens. Goto and Tatsuoka [43] observed that the friction angle measured in samples of and in triaxial devices with lubricated ends platens defers in about 1°. Hence, , or possibly slightly higher, is recommended herein.
4.2. Moist Tamping Technique and Undercompaction Method
In this paper, the moist tamping technique simultaneously with the undercompaction method is considered the appropriate reconstitution method for a clear definition of the CSL, as described above. With the moist tamping technique, the sample is assembled by depositing and tamping damp material through several layers for better control of the pursued void ratio. The moist condition creates capillary forces (suction) between the soil grains that allow for material compaction with low densities, which probably would not be possible with other remoulding methods. However, when compacting in layers, these layers may have different void ratios, as the compaction of each succeeding layer can further densify the lower layers. The undercompaction method (see Ladd [72]) reduces soil grain segregation and ensures a uniform sample density throughout the specimen, a fundamental aspect of sample remoulding. This method consists of compacting the layers to a lower density than the final desired value by a predetermined amount defined as percent undercompaction (). Therefore, the weight of soil in each layer increases from bottom to top to accommodate the additional compaction that occurs in underlying layers, ensuring the same void ratio in all layers. The percent undercompaction in each layer is calculated as
where is the percent undercompaction selected for the first bottom layer, and is the percent undercompaction for the final top layer (usually zero); is the total number of layers, and n is the selected layer (note that the first layer to be compacted is the bottom one, which will correspond to ). Although widely used, techniques to establish what value of should be adopted do not appear to have achieved a consensus [73]. The authors will further present their recommendations for the values of .
Once the number of layers, sample density and water content to be used in the compaction are defined, the total wet weight () of material required for sample preparation is determined by
in which is the dry unit weight, the water content and the total volume of the specimen. The moist weight of material required at each layer is given by Equation (3). Note that the is the cumulative weight at the top of the n layer. The weight per layer will be deducted by subtracting the underlying layers’ weight.
4.3. Compaction Mould and Tamper
The specimen is remoulded inside the latex membrane, which is attached to the base of the triaxial cell, resorting to an internal split mould and a tamper to compact the sample. The non-standard compaction mould and tamper are based on the model proposed by Jefferies and Been [7], which accommodates enlarged platens and other minor modifications. Such a mould can be used in different triaxial cells since lengthens can adjust the mould height to the lower platen. Figure 9 presents a scheme with the mould and tamper components.
During sample preparation, the upper ring holds the membrane between the collar and the mould. A vacuum pressure of about 50 kPa is also applied to ensure the perfect adjustment of the latex membrane with the mould and, with that, a uniform diameter throughout the sample. The upper ring has the same diameter as the top platen, so once the sample is fully remoulded, the bracelet is removed and the upper cap is carefully placed on the notch to ensure a perfect arrangement. The cut-out of the mould assures a horizontal position of the top platen and prevents an over-compaction of the upper part of the sample since it stops the platen from being pushed beyond its position. The collar works as an interface for tamping.
The non-conventional compaction hammer (Figure 9b) controls the layer height when reconstituting samples through the moist tamping technique. The height adjusters regulate the drop height of the tamper inside the mould to a predefined level, providing the desired layer thickness and compaction. The upper and lower plate act as a stopping point on the collar when tamping. Another particularity of this mould is the two points/locations to apply the vacuum, which allow for the attachment of the latex membrane to the mould wall (Figure 9a). The upper input of the vacuum ensures that the membrane continues to firmly stretch during the compaction of every layer. If a single vacuum inlet is used, once the layer that is located at the same level is compacted, the vacuum effect is suppressed and the membrane tends to contract. When remoulding very loose samples, this could lead to diameter fluctuations along the specimen, decreasing from bottom to top, as illustrated in Figure 10a. This ‘mushroom’ effect will generate a non-uniform density along the specimen and the potential formation of shear bands due to the inconsistent response of the specimen (Figure 10b). Overall, shear localisation on specimens (even in medium loose samples) can induce unrepresentative measurements of volume change and induced pore pressure during shear loading, on drained and undrained triaxial tests, respectively.
5. Proposed Testing Procedures
The triaxial testing can be carried out according to the ASTM procedures D4767 [74] and D7181 [75] or other standards (e.g., CEN/ISO). The current paper aims to portray an undemanding procedure that could be easily implemented and accessible to any academic or commercial geotechnical laboratory. The test procedures recommended in this section seek to increase the accuracy and simplicity in the techniques used to define the CSL. Test methods will generally focus on the creation of loose cohesionless specimens taking advantage of the improved components in the triaxial apparatus. The soil specimens remoulded for such conditions tend to show contractile behaviour, which allows a reliable measurement of the CSL.
5.1. Soil Preparation
One of the features that guarantee the representativeness of the CSL regards the material that is used to reconstitute the soil specimens in the laboratory. The material must not be reused between tests since the soil can present grain changes or transitional behaviour, which should be verified as described before. Therefore, all samples should be remoulded with original material.
In addition, it is crucial to guarantee the homogeneity between the soil specimens used to define the CSL. If the material is in a wet condition, it should be dried first to facilitate user handling. Moreover, if the material has a high fines content (i.e., clods of silt and clay throughout the specimen), they must be carefully unbound without crushing the soil particles and mixed up. Afterwards, the sample can be divided and reduced to testing size using the quartering technique (e.g., standard testing procedure ASTM C702 [76]), which minimises the variations between the different fractions. All portions are stored and oven-dried before remoulding the sample. These steps ensure the homogeneity and the representativeness of the material used to assess the CSL. However, additional procedures may be needed if the soil contains dissolved solids or chemical products that may influence the soil behaviour during testing.
5.2. Remoulding of Soil Specimens
The adopted procedure for specimen remoulding is described in this section. It follows the moist tamping technique combined with the undercompaction method, previously described, adapted for six layers. The number of layers to be used in the preparation of the specimen may vary accordingly to the specimen diameter and the required dry unit weight; however, the maximum thickness of the layers should not exceed 25 mm. The gravimetric water content to be used in the compaction process may differ according to the studied soil (e.g., 5% for sands or 15% for silty mining tailings). Ultimately, the definition of depends on the user sensibility to adopt a water content that can effortlessly achieve the pursued loose state. The same applies to the value of , which can fluctuate according to the target void ratio (from 0% on dense samples to 15% on very loose samples) or to high values of specific gravity (as the material self-weight can aggravate the densification of the lower layers).
The adopted procedure for remoulding soil specimens ensures a more uniform density distribution within the specimen. The exact internal variation in initial density seen in a particular sample is likely to depend both on the number of layers and on the undercompaction ratio used. However, regardless of the exact initial distribution of internal sample void ratio, Thomson and Wong [77] showed that there is a tendency for each zone to tend towards a unique CSL. For this reason, the undercompaction ratio, number of layers and water content selected when compacting a sample will not influence the CSL parameters. It is noteworthy that this statement is only valid when testing the ultimate state in loose samples, as these remoulding conditions will influence the soil behaviour (e.g., compressibility parameters, stress/strain shearing paths and even cyclic or dynamic testing response).
The process starts with the preparation of the material and equipment. This phase covers the preparation of the lubricated ends platens, the positioning of filter paper and the adjusting of the latex membrane to the bottom platen using two O-rings. Afterwards, the split mould is assembled and 50 kPa vacuum is applied to draw the membrane with the mould, as previously illustrated in Figure 9a. Meanwhile, the soil is prepared. Knowing the amount of material needed, the weight distribution by layers and the water content to be used in the sample preparation, the soil can be properly mixed with de-aired water to obtain the moist content intended. Each material will require the use of a certain pore water, from tap water to distilled water or even deionised water if no particular liquid is specified (which is commonly the case with marine sediments or mining tailings). The wet material must be saved in a sealed recipient during the compaction process to avoid air drying. The real water content of the soil specimen is estimated by taking two samples of that mixture, one before placing the first layer and the second after finishing the compaction. The average moisture value corresponds to of the soil. Figure 11 illustrates the remoulding procedure using the undercompaction moist tamping technique.
The first portion of soil is poured into the mould and distributed around the base with a spoon (Figure 11a). The layer is lightly tamped using the compaction hammer until the tamper hits the stopping point in every simple stroke (Figure 11b). Before tamping, the height adjuster is regulated so that the compaction foot tamps exactly at the top of the layer, avoiding an over compaction of the soil. To avoid planar surfaces between layers, the tamped layer must be superficially scratched. Both layer deposition and tamping process are repeated for all layers until fully remoulding the soil specimen.
A uniform density profile is intended; however, because the tamping compaction is more effective on the upper part of the layer, the specimen can present a ‘zig-zag’ pattern [78] due to higher densities near the top of each layer. Figure 12 shows a clear ‘zig-zag’ pattern of a soil specimen in the triaxial equipment compared to a regular one. Thomson and Wong [77] showed that these samples’ uniformity improved significantly during shearing, allowing a reliable estimation of the CSL. However, this effect is an important concern for the triaxial testing because the area correction method used in this approach (further described) considers the sample as a right cylinder. Even though the ‘zig-zag’ effect does not influence the shearing behaviour, it can introduce a miscalculation on the volume changes during triaxial stages if the pattern is pronounced.
After compacting all layers, the upper platen (also lubricated and using filter paper) is placed, and the membrane is attached to the top cap using 2 O-rings (Figure 11c). Once the sample is isolated, the mould can be removed by applying vacuum (≈ kPa) to the soil specimen through the drainage lines to help the soil specimen to keep its shape and then its density (Figure 11d). The height and diameter of the sample are measured using a caliper rule to estimate the initial density, allowing the membrane thickness to be deduced.
At this point, the isolation and seal of the latex membrane can be verified. For this purpose, the drainage lines are closed, and if the specimen starts losing its suction, this may imply that the membrane was punctured or ripped during the reconstitution process. If the membrane is in good condition, the test may begin; otherwise, the sample must be disassembled because it will not reproduce the right behaviour in the forthcoming stages. If the conditions are appropriate for testing, the remainder of the triaxial cell is then assembled, filled with de-aired water, and a cell pressure of 10 kPa is applied in order to remove the vacuum.
5.3. Sample Saturation
The saturation process is fundamental for a proper assessment of the CSL, as the constant volume (or undrained) conditions cannot be assumed unless the soil is fully saturated. In drained tests, the volume change is estimated by measuring the amount of water entering or leaving the saturated soil specimen. The importance of the full saturation of soil is more pronounced in undrained tests since the development of pore-water pressure strongly depends on the stiffness of the pore fluid. Considering that the compressibility of water and air are significantly different, a small amount of air can have a large effect on the soil response. Hence, the saturation of the samples is fundamental to provide reliable values of pore water pressure and volume change during testing.
5.3.1. Carbon Dioxide Method
The use of carbon dioxide (CO) before the water flushing significantly aids the full saturation of the soil specimen, since this inert gas is more soluble in water than air is. After the sample preparation, the CO is introduced with low pressure (≈3 kPa) from the bottom drainage line, forcing the air to circulate upwards in the soil specimen. A tube connected to the top drainage line, which is open and submerged under water, allows for monitoring the bubbling velocity and the percolated volume of CO. During this phase, it is important to monitor the gas pressure, to avoid any pore pressure build-up that could reduce the mean effective stress and to prevent the CO from piping or flowing up in preferential pathways rather than displacing the air. Note that CO is denser and less compressible than air. To ensure complete replacement of the air, the flushing of CO is done for about 60 minutes or until the equivalent of one litre of the gas is displaced. The main advantage of using CO is to achieve the full saturation condition of cohesionless soils faster than other saturation methods [7,44].
5.3.2. Water Flushing
Since this procedure aims to achieve a full saturation condition, the use of de-aired water inside the specimen is essential, as most of the dissolved gas (mixture of air and CO) present in the fluid was already removed. However, if the material tested contains some dissolved solids (such as salt), deionised water should be used instead to avoid any pore fluid chemistry issues affecting the CSL definition [73].
5.3.3. Backpressure Increment
Small air bubbles may remain attached to the soil grains after water percolation and can be difficult to flush out. The full saturation condition is then achieved by applying high pressures to the pore fluid to cause the pore air to dissolve completely into the pore water. The backpressure is gradually increased to high values while keeping a low effective stress (approximately 10 kPa). In the authors’ experience, a backpressure equal to 300 kPa together with the use of CO and water flushing provides a full saturation condition. Currently, some commercial triaxial chambers are designed for pressures up to 1700 kPa, and some controllers can apply 2000 kPa of pressure, which allows for implementing other backpressure values during soil saturation. However, for some plastic or fine soils, additional techniques to achieve full saturation may be needed, namely the double vacuum during water flushing [79], and the increment of backpressure to even higher values or a percolation under pressure. These topics will be further discussed.
5.3.4. Evaluation of the Degree of Saturation
The saturation of the soil specimen can be determined by measuring the value of the pore pressure coefficient B, as defined by Skempton [80], where an increment in the cell pressure () is applied under undrained conditions, and the corresponding increment of pore pressure () is measured. In fully saturated conditions, , and the B-value is of about 1.0. However, a high B-value does not always guarantee full saturation for every type of soil [44], which is particularly important when undrained tests are preformed and especially when liquefaction susceptibility is studied. For sandy soils, the B-value at full saturation condition varies from 0.90 to 0.99, but it can be lower than such a range in stiff and coarser geomaterials [81,82].
However, P-wave velocity () better indicates the full saturation of soil since it increases harshly from 90% to 100% degree of saturation [83]. Due to this unreliability of the B-value, a correlation of this parameter with the P-wave velocity () provides a theoretical framework to validate the full saturation condition of the soil. In triaxial tests, the propagation time of the P-wave is measured by using bender/extender elements, which are embedded in the platens of the triaxial chamber [84,85] or simply bender elements if a proper analysis is conducted, as presented by Ferreira et al. [85]. However, the authors do not recommend using bender/extender elements when the end-of-test soil freezing is adopted, due to possible damages in the piezoelectric transducers.
For granular soils, a B-value of higher than 0.97 is recommended to indicate the full saturation condition. This recommendation of B-value is based on comparisons between such a parameter against the P-wave velocity (). In saturated soils, the values are higher than 1482 m/s since the wave propagation is commanded by water [86]. Theoretical models for describing the evolution of Vp and B-value as a function of the degree of saturation () have been presented by [87,88,89,90,91]. All , B-value and relations are based on continuum mechanics [92,93].
Figure 13 presents the evolution of both and B-value as a function of the degree of saturation, together with the calibration of the B-value with by applying the wave propagation theory in fluid-saturated porous media. Additionally, experimental data obtained from TP-Lisbon sand—soil characterisation details in [94]—to contrast and corroborate the theoretical model are also presented in Figure 13. From this figure, it can be observed that the full saturation condition (i.e., m/s) is achieved for a B-value of about 0.97, which is consistent with that observed by [81,83]. These findings allow for validating a proper consideration of the B-value, and then guaranteeing the full saturation conditions of the soil specimens that will define the CSL.
5.3.5. Percolation under Pressure
In case the full saturation is not reached after the backpressure increment, an efficient saturation procedure is to impose percolation under pressure. Different pressures are applied at the ends of the sample, higher at the base than on the top, forcing the water to seep through and in and out of the specimen. The differential pressure must respect the internal equilibrium of the pore pressure ( kPa) and maintain the effective confinement of 10 kPa to avoid an overconsolidation of the sample (e.g., cell pressure ≈ 310 kPa, bottom backpressure ≈ 303 kPa and top-pressure ≈ 297 kPa). For low permeability soils, the pressure difference between the drainage ports can be increased. From the authors’ experience, this process involves the flushing of at least 100 cm and must be repeated until the full saturation condition is achieve. If needed, an additional back pressure increment (usually up to 500 kPa) will speed up the saturation process, provided that the post-consolidation stresses are compatible with the equipment capacity. In addition, extra time under high backpressure can increase the degree of saturation.
5.4. Consolidation Phase
Laboratory testing aims at simulating the field stress conditions as close as possible; the applied consolidation pressures should correspond to a likely stress state on the field or defined by the project for specific purposes before shearing. The reference effective confining pressure and the previous stress history of the soil establish all aspects of its behaviour. For that reason, different initial stress states are required to define the CSL of any soil. However, for CSL definition, large ranges of confining pressures can be tested as long as the limitations of such studies are recognised (such as flow instability or evolution in grain size distribution or morphology).
In addition, isotropic consolidation is often used in practice, although the stress state in the field is commonly anisotropic. It is well known that in the laboratory, the anisotropic consolidation of soils requires advanced triaxial equipment, but the present work aims at an undemanding procedure that can be easily implemented and accessible to any academic or commercial geotechnical laboratory. Hence, isotropic consolidation is recommended to assess the critical state parameters due to the uniqueness of the CSL and independence of initial soil fabric [5,10,29]. For both isotropic and anisotropic consolidations, the drainage valves are open to allow the drainage of the sample, avoiding the pore pressure excess. An automatic volume gauge instrumented with an electronic displacement transducer (e.g., LVDT transducers) monitors the drainage of soil. Moreover, a gradual pressure ramp is recommended to track the variation of void ratio.
5.5. Shear Phase
During triaxial testing, the specimens are loaded to failure by increasing the axial deformation while keeping the cell pressure constant. For drained conditions, shear loading by axial compression is imposed with an axial strain velocity compatible with the excess pore pressure dissipation rate that guarantees the effective stress. A suitable loading for ensuring the complete drainage of soil can be defined using the consolidation parameters— or [95]. In undrained tests, the shearing velocity is not critical, but it should be low enough to secure equalisation of the pore pressure at failure.
The undrained shearing stage begins by closing the drainage valves before shear loading. As no drainage is allowed, the tendency of the soil to change volume is reflected by a variation in pore pressure. Because of the undrained condition, no volume changes in the fully saturated sample are induced. Therefore, the water content and void ratio at the end of the test are the same at the end of consolidation. In drained shearing, the drainage valves are open. The specimen will expel or absorb water to keep the effective stress of the consolidation stage. A soil specimen changes volume during shearing in a drained test. Hence, the water content, the void ratio and the dry density of the sample at the end of the test are distinct from the beginning of shearing.
During this stage, an automatic volume gauge measures the specimen volume changes, the axial displacement is quantified with an electronic displacement transducer and the load should be measured through a submersible internal load cell. Usually, the monotonic shearing is applied under strain control by increasing the deformation up to the ultimate or critical state. Following the end of the triaxial test, the specimen must be inspected for any localised shear band or other abnormalities that may affect the results and definition of CSL. The recommended procedures to measure the final void ratio are detailed below.
5.6. Data Correction
For a proper interpretation of the results during the shearing phase, it may be necessary to apply some corrections to the measured quantities. The corrections must be evaluated relative to their importance for the final values/results of the tests. Due to critical state testing generally implying large strains, an area correction method and the membrane effect should be quantified. When using lubricated end platens, the right circular cylinder (RCC) can be maintained for axial strains higher than 20%. Therefore, the reported stresses must be corrected in terms of the sample cross-section evolution since the specimen is compressed. Considering that the specimen deforms as a right cylinder, it can be assumed that the corrected area of the sample (A) during shearing is given by
where is the initial cross-section area of the sample at the start of the shear (end of consolidation).
The main stresses can also be influenced by the presence of the rubber membrane. For this reason, the data should be corrected considering two major effects: (i) membrane penetration and (ii) membrane stiffness. When a triaxial test is performed on a granular soil, the membrane enclosing the triaxial specimen tends to penetrate the voids between the particles at the interface, which can cause an experimental error. In a drained test, the measured is not only representative of the soil skeleton compression but also includes the volume of water that is forced out due to the membrane penetration. In undrained conditions, as the pore pressure increases, the water inside the sample tends to move to the lateral surface, refilling the voids. As a result, the measured is underestimated.
The membrane penetration effect depends mainly on the soil particle size but also on the specimen density and overall geometry, the range of effective confining stresses during a given test and the modulus and thickness of the latex membrane. According to Nicholson et al. [96], membrane-compliance effects may be negligible for sands and silts tested in conventional 71 mm diameter samples, since even very thin membranes cannot penetrate significantly into the small surficial voids. Since this paper deals with granular soils (sandy, silty and non-plastic geomaterials), the membrane penetration effect was not taken into account. However, this effect must be considered for testing of gravels in large scale specimens—commonly used for the characterisation of geomaterials in transportation infrastructures [97].
Another implication inherent to samples that, during shearing, reach high levels of strains is due to the rubber membrane stiffness. As deformation occurs, the membrane tends to constrain the specimen laterally, making the radial stress truly applied higher than the one that is measured. Consequently, the axial stress is also influenced due to the load taken by the membrane. Therefore, the stresses acting on the specimen must be corrected considering the membrane stiffness. The literature presents many different correction methods; however, the authors recommend the expressions given by Duncan and Seed [98,99] because these corrections can be applied to a large number of criteria (large strains, drained and undrained conditions and compression and extension tests). This effect is more pronounced at lower stress levels [44]. The corrections to the axial () and radial () stresses are the following:
where is the initial thickness of the membrane, the elastic modulus for the membrane and the initial diameter of the specimen. Standard triaxial latex membranes with mm and MPa are used in UPorto.
5.7. Void Ratio Measurements
The measurement of the void ratio (e) of samples in triaxial tests is one of the most important aspects in determining the CSL. Furthermore, it is one of the variables more subject to be miscalculated, particularly in loose samples. While it is relatively simple to estimate the initial void ratio through the initial sample dimensions, dry weight and water content, the volume changes during sample saturation (including sample flushing and back pressure increasing) can lead to significant errors if ignored, as exposed by Sladen and Handford [23]. During saturation, samples experience deformations due to the soil collapse or changes during the stresses’ ramp application and the release of surface tension effects in moist samples. However, volume changes during saturation are particularly difficult to measure because of the air existence in the voids of the soil, the water lines and porous stones after water flushing. An accurate approach to overcome these challenges is to measure the sample volume at the end of the test and then calculate the volume change during saturation. Hence, the axial strain is estimated considering the direct measurements of the LVDT, while the radial strain is estimated by applying the relations of volumetric and axial strains for a perfect cylinder.
In this paper, the authors recommend the end-of-test soil freezing (EOTSF) technique proposed by Sladen and Handford [23] because of its precision and simplicity of void ratio measurement through the final gravimetric water content (GWC). The final volume is used to calculate the void ratio at the ultimate state, and data processing is made from the end of the test to the beginning. This technique consists of freezing the specimen at the end of triaxial testing, ensuring that the final void ratio is accurately determined by keeping the water volume inside the specimen at the end of the shear stage. Thus, once the test is finished, the sample is isolated by closing the drainage valves (if not already done), the cell pressure is reduced to zero, the piston is unloaded and the cell chamber fluid is drained. The triaxial cell is disassembled as much as possible without breaking the ‘seal’ on the sample and placed in the freezer.
Once the sample is frozen, it can be removed intact and weighed without losing water or soil. The weight from the adherent items (membrane, filter papers and lubricated ends) is deducted, and the water content is determined from the oven-dried weight of the sample. Note that by the end of the shearing phase, especially in loose samples with low confining pressures under undrained conditions, the soil specimen is very unstable, as segregation occurs due to liquefaction, resulting in a challenging sample recovery. The handling of the sample is significantly improved by freezing it, which will allow for a reliable water content measurement.
This method cannot be used if the platens are set up with electronic equipment such as bender elements, as freezing will damage these components. In such cases, the void ratio can be determined through the direct measurement of end-of-test GWC, providing that during the sample removal no water or soil is lost. The same can be applied to denser samples, as they will remain quite stable after shearing and will be easier to handle.
The final volume is determined by assuming a non-loss of the water in the specimen voids, which is completely saturated using the relation , where is the specific gravity of the soil, is the water content and is the degree of saturation. With this final void ratio and the continuous measurements of volume changes, the void ratio is easily determined at the beginning of both consolidation and shear stages.
Moreover, during the percolation and saturation, the axial shortening of the sample can be measured using the top guided piston guidelines (see Figure 7). The volume change during these stages can be estimated by assuming that the volumetric strain is isotropic—that is, the total volumetric strain is three times the axial strain. This volume can be included in additional approaches of void ratio measurement, as part of internal checks by the laboratory. The authors also recognise other methods for obtaining accurate void ratios, such as cell calibration and Verdugo and Ishihara’s [36] methods. In the cell calibration method, the ‘corrected’ cell volume change is assumed to be equal to the sample volume change during saturation [100], while Verdugo and Ishihara’s [36] method covers, after shearing, the removing of additional water from the sample by increasing the cell pressure, allowing for an easier sample recovery. These methods, if used correctly, may be equally accurate to the EOTSF. However, they are complicated, time-consuming and depend on the operator expertise, which is not the intention of this paper.
6. Validation of the Proposed Procedures and Discussion
6.1. Description of Tested Soils
The test procedures proposed herein were compared by compiling critical state parameters reported in the literature for four cohesionless soils (two sub-angular and two sub-rounded with distinct origins). These soils correspond to a sandy silt gold tailing [48], a calibrated sand with uniform grain size distribution known as Coimbra sand [101], the historically liquefiable TP-Lisbon sand [94] and the well-characterised Hostun sand [102]. The sandy silt gold tailing and Coimbra sand have already been studied within the scope of a programme of two round robin tests, in which the University of Porto (UPorto) participated. The CSL results provided by [48,94,101] included experimental data obtained from different test procedures and triaxial apparatus configurations, ideal for validating the proposed test procedures of this paper. Test results reported by [102] only included one triaxial configuration; however, one of the tests that these authors considered representative of CSL was replicated by applying the same state conditions but using the triaxial improvements proposed in this paper. Table 1 summarises the physical properties of the studied soils. Figure 14 presents the grain size distribution of the studied soils.
6.2. Reproducibility of the Proposed Test Procedures
A series of triaxial tests were carried out under drained conditions on Coimbra sand to assess the reproducibility of the procedures addressed herein. Figure 15 presents the results of three drained tests conducted on soil specimens with similar void ratio after an isotropic consolidation of 20 kPa. A comparison between these results revealed very similar behaviour of soil and final values of deviatoric stress (q), mean effective stress () and void ratio (e). Although the three tests showed small variations, they converged to the same CSL. Therefore, these comparisons provided experimental evidence regarding the reproducibility of the unbiased procedures recommended in this paper.
6.3. Behavioural Consistency by Applying the Proposed Procedures
To assess the behavioural consistency of soil testing by applying the unbiased procedures of this paper, a series of drained and undrained triaxial tests were compared. Reid et al. [48] observed a more conceptually consistent behaviour of soils during drained triaxial shearing when using an embedded top-cap loading piston, as adopted by UPorto. This effect has not been discussed in detail in the context of the potential impacts of the CSL assessment. Baldi et al. [14] stated that the use of an embedded top-cap loading piston ensures a perpendicular alignment between the soil specimen and triaxial cell during all phases of triaxial testing and leads to a more uniform shearing.
Figure 16 presents a series of direct comparisons between triaxial test results to highlight the effects of using the embedded top-cap loading piston. These results are compared in terms of strain-softening and volumetric strains. Moreover, the test comparisons were performed in the three soils described in Section 6.1 under the same confinement pressure and very similar relative density (or void ratio) after consolidation. For gold tailing results, all tests were carried out in triaxial apparatuses with lubricated end platens, as reported by [48]. For the other three studied soils, only the results of the recommended triaxial configuration herein were obtained in triaxial cells with lubricated end platens; thus, the other results were obtained from tests carried out in non-improved triaxial apparatuses.
Figure 16 indicates that the strain-softening increased for higher values of mean effective stress. Moreover, the comparisons of normalised behaviour in Figure 16 present strain softening in the tests carried out without the embedded top-cap loading piston of gold tailing, which is conceptually inconsistent for soils with contractile behaviour. Likewise, comparisons showed the stabilisation of stress ratio after 25% axial strain. This tendency was observed even for the soils with dilative behaviour, indicating that the soil specimen did not develop strain softening after the maximum dilatancy. On the other hand, the analysis of the tests revealed that the use of the embedded top-cap loading piston increases the volumetric strains in soil specimens with contractile behaviour (see Figure 16b,f) and reduces the volumetric strains in soil specimens with dilative behaviour (see Figure 16d,h,j). This behaviour is conceptually coherent due to the reduction of shear bands—induced by the specimen ‘tilting’ during triaxial shearing. Experimental evidence demonstrated that the unbiased procedure of this paper provides results conceptually more consistent, due to the fact that both strain softening and the stabilisation of the volume change effects can induce relevant errors for defining the CSL.
From the paired results of Figure 16, the following main advantages of implementing the embedded top-cap loading piston in triaxial apparatuses can be observed: (i) reduction of strain-softening and (ii) the stabilisation of the volume change. The reduction of the strain-softening is related to the minimisation of eccentric loads, which can occur when the coaxial position between the soil specimen and triaxial cell disappears. In addition, such a minimisation reduces the generation of shear bands to a minimum level. This reduction leads to the stabilisation of the volume change since shear bands concentrate the volumetric strains in specific zones of the soil specimen during triaxial shearing [14,40,69]. Therefore, the use of an embedded top-cap loading piston in the triaxial apparatus is essential as it minimises progressive eccentric loading, conceptually assuring a more uniform soil condition during loading, as it should always be.
On the other hand, the undrained triaxial tests were conducted on soil specimens on the gold tailing. These specimens were isotropically consolidated under 20, 50 and 200 kPa. All samples showed a B-value , which guaranteed the full saturation conditions of the soil. Such conditions were achieved with a backpressure of 300 kPa. Moreover, all samples had the same state parameter (deduced from the CSL presented below in Section 6.4) at the beginning of triaxial shearing. Figure 17 presents the results of three undrained tests carried out with the recommended procedures herein.
From Figure 17, it can be observed that all soil specimens triggered flow liquefaction. This behaviour is consistent because all tests were carried out for soils in the contractive side of the CSL. Furthermore, it was recognised that the instability points align to the same , as expected for soil specimens tested with the same state parameter. On the other hand, after the triggering of liquefaction, the stress-path converged to the same frictional state defined by the CSL. The consistency of the ultimate frictional state is a consequence of the friction reduction provided by the lubricated end platens during triaxial shearing. The results of the undrained tests of Figure 17 validated the behavioural consistency of the unbiased procedures of this paper.
6.4. Comparisons of CSL Results against Other Procedures
A comparison using the data reported within the scope of a ‘round robin’ programme to assess the CSL of a sandy silt gold tailing [48] was used to compare and validate the testing procedure proposed herein. Test results obtained from the different triaxial apparatus configurations were considered, namely the use or not of lubricated end platens and the embedded top-cap loading ram connection. In all considered tests, the EOTSF was applied because this method increases the reliability of void ratio measurements after testing [5,7,48]. Moreover, three aspects of the test results were compared: (i) the strain softening and stabilisation of volumetric strain, (ii) the stress path under undrained conditions and (iii) test path (TP) and state parameter of the inferred CSL using the method proposed herein. Compiled results are from both academic and commercial laboratories, including the University of Porto (UPorto), the University of Western Australia (UWA), Golder–Perth (P) and Vancouver (V), BGC Engineering Inc. (BGC) and Klohn Krippen Berger (KCB). Table 2 summarises the conditions of the selected tests.
In this study, the CSL of the sandy silt gold tailing was inferred from the drained triaxial tests results of UPorto by applying the unbiased procedure of this paper. The equation adopted to define the CSL in the space is the following:
Such an equation was obtained by the latest squares regression method under a correlation coefficient, .
To examine the differences between test procedures, test-paths (TP) that started from the same mean effective stress of the tests used for inferring the CSL were paired. Figure 14 presents a comparison between the TP of the procedure proposed herein tested against the corresponding TP of other testing methods. From Figure 18, it can be observed that the TPs of the proposed method have the same shape, demonstrating the representativeness of the soil specimens and consistency of the preparation and reconstitution method. However, the TPs of the other methods have different shapes and finish in different points when compared against the TPs of the proposed method. Such differences affect both the position and slope of the CSL. Table 3 specifies the coordinates of the points inferred as critical state and the final values of paired tests.
The comparison between testing procedures revealed that the procedure proposed herein provides a CSL more compressible than the other procedures. This compressible CSL reliably indicates whether the soil has a dilating or contracting behaviour, resulting in safer designs and analyses of geotechnical structures than the other testing procedures. The compressibility of CSL is validated by comparing the paired tests referred to in Table 3, which indicate that the differences between final values increase with the confining pressure. Figure 19 presents direct comparisons between all triaxial equipment improvements in terms of undrained behaviour. These comparisons considered the undrained tests referred in Table 2, which were carried out under the same approximate conditions (i.e., similar and ). The potential differences were interpreted using the CSL in the space, with inferred from the same tests of Figure 17, and assuming an instability line (with the stress ratio thereby represented, ) estimated by the maximum deviatoric stresses or peak value points of the tests carried out by applying the unbiased procedure of this paper.
The comparisons between procedures revealed different stress-paths, which lead to different coordinates of the instability points. The instability points of the tests conducted with only the embedded top-cap ram connection are closer to the CSL, validating the reduction of the strain-softening during the shear phase. In addition, the stress-path of tests that involved the lubricated end platens converged to the CSL after reaching the instability point. Tests performed with only the lubricated end platens have instability points with the lowest value of peak deviatoric stress (see Figure 19a), indicating a lower undrained strength and brittleness. On the other hand, it can be observed in Figure 19a that the results of non-lubricated end platens presented a higher friction than the results of lubricated end platens after liquefaction. Tests conducted in the triaxial cells with lubricated end platens follow a stable frictional state controlled by the movement of the soil particles. The differences in the stress paths of the tests carried out without lubricated end platens are due to the friction generated by the porous stones, which induced higher stresses at the end restraints during soil shearing.
7. Summary and Concluding Remarks
This paper described and detailed unbiased procedures to assess the critical state locus of soils from triaxial testing. The combination of lubricated end platens, an embedded top-cap loading ram connection and the end-of-test soil freezing together with the full saturation conditions of soil specimens in triaxial testing provides a reliable characterisation of the CSL. The triaxial results of different cohesionless soils (with distinct origins and morphologies) and comparisons against other testing procedures led to the following conclusions:
- The use of an embedded top-cap loading ram novel connection reduces the ‘tilting’ of the soil specimen during all phases of triaxial testing, ensuring a perpendicular alignment between the loading ram with the axis of the soil specimen that leads to conceptually consistent soil behaviour. Such consistent soil behaviour was experimentally validated by triaxial tests carried out in four cohesionless soils. Furthermore, the soil response is caused by a reduction of strain-softening and the stabilisation of the volume change during triaxial loading, even for soil specimens with dilative behaviour.
- The combination of oversized lubricated end platens and an embedded top-cap loading ram connection in the triaxial apparatus results in a uniform shearing without the generation of spurious shear bands, allowing for a reduction of strain softening and the stabilisation of volumetric strain, which are determinant factors for the identification of the CSL. However, the use of oversized lubricated end patterns is more relevant during undrained shearing at low effective confinement stresses, whereas the use of an embedded top-cap loading ram connection causes a more conceptually consistent soil behaviour at the large strain range.
- The comparisons between triaxial configurations showed that the unbiased procedures proposed herein have very low variability and have a notable reproducibility. In addition, they provide reliable results that often are non-conservative in comparison to those obtained by means of other procedures. Hence, it is desirable that the unbiased procedures be implemented in geotechnical laboratories in which the characterisation of soils within the CSSM framework is conducted.
Author Contributions
Conceptualisation, A.V.d.F., D.C. and F.M.-G.; data curation, A.V.d.F.; formal analysis, A.V.d.F., D.C. and F.M.-G.; funding acquisition, A.V.d.F.; investigation, A.V.d.F., D.C. and F.M.-G.; methodology, A.V.d.F., D.C. and F.M.-G.; resources, A.V.d.F.; supervision, A.V.d.F.; validation, A.V.d.F.; visualisation, D.C. and F.M.-G.; writing—original draft preparation, D.C.; writing—review and editing, A.V.d.F. and F.M.-G. All authors have read and agreed to the published version of the manuscript.
Funding
This work in FEUP was funded by: Base Funding—UIDB/04708/2020 of the CONSTRUCT—Institute of R&D in Structures and Construction funded by national funds through the FCT/MCTES (PIDDAC). The third author acknowledges the financially support of FCT through the grant SFRH/ BD/146265/2019.
Acknowledgments
Acknowledgements are due to Ricardo Bahia—Director of Golder Associates Portugal—for the fruitful collaboration that led to these novel procedures. Acknowledgements are especially due to David Reid from the UWA for providing the supplemental data with the test results of the ‘round robin’ programme of the silt sandy gold tailing. The authors also acknowledge Paulo Coelho from the University of Coimbra for offering the data of the ‘round robin’ programme of Coimbra sand and Ricardo Azeitero for offering their experimental results of Hostun sand. The authors also acknowledge the technical support given by Daniela Coelho and Armando Pinto of LabGeo.
Conflicts of Interest
The authors declare no conflict of interest.
Nomenclature and Abbreviations
Nomenclature
| constants of the CSL power-law model | |
| corrected area of the sample | |
| initial cross-section area of the sample | |
| B | pore pressure coefficient |
| initial diameter of the specimen | |
| e | void ratio |
| initial void ratio | |
| void ratio at critical state | |
| elastic modulus for the membrane | |
| specific gravity of the soil | |
| H | height |
| M | slope of critical state in space |
| n | selected layer |
| total number of layers | |
| n | porosity |
| mean effective stress | |
| q | deviatoric stress |
| degree of saturation | |
| initial thickness of the membrane | |
| time factor corresponding to 50% consolidation | |
| time factor corresponding to 90% consolidation | |
| u | pore pressure |
| percent undercompaction | |
| percent undercompaction selected for the first bottom layer | |
| percent undercompaction for the final top layer | |
| P-wave velocity | |
| total volume of the specimen | |
| moist weight of material required at each layer | |
| total wet weight of material required for sample preparation | |
| dry unit weight | |
| intercept of critical state in e: log p´ space | |
| increment in the pore pressure | |
| volume change | |
| CP | increment in the cell pressure |
| axial strain | |
| volumetric strain | |
| instability line | |
| slope of critical state in e: log p´ space | |
| axial stress | |
| radial stress | |
| diameter | |
| gravimetric water content | |
| initial gravimetric water content |
Abbreviations
The following abbreviations are used in this manuscript:
| ASTM | American Society for Testing and Materials |
| CO | carbon dioxide |
| CSL | critical state locus |
| CSSM | critical state soil mechanics |
| DP | dry pluviation |
| EOTSF | end-of-test soil freezing |
| GSD | grain size distribution |
| GWC | gravimetric water content |
| LEP | lubricated end platens |
| LRC | loading ram connection |
| LVDT | linear variable differential transformer |
| MT | moist tamping |
| NCL | normal consolidation line |
| SD | slurry deposition |
| TP | test path |
| WS | water sedimentation |
References
- Roscoe, K.H.; Schofield, A.N.; Thurairajah, A. Yielding of Clays in States Wetter than Critical. Géotechnique 1963, 13, 211–240. [Google Scholar] [CrossRef]
- Jefferies, M. Nor-Sand: A simple critical state model for sand. Géotechnique 1993, 43, 91–103. [Google Scholar] [CrossRef]
- Bedin, J.; Schnaid, F.; Viana da Fonseca, A.; Costa Filho, L.D.M. Gold tailings liquefaction under critical state soil mechanics. Géotechnique 2012, 62, 673–682. [Google Scholar] [CrossRef]
- Andrade, J.E. A predictive framework for liquefaction instability. Géotechnique 2012, 59, 673–682. [Google Scholar] [CrossRef] [Green Version]
- Soares, M.; Viana da Fonseca, A. Factors Affecting Steady State Locus in Triaxial Tests. Geotech. Test. J. 2016, 36, 20150228. [Google Scholar] [CrossRef]
- Giretti, D.; Fioravante, V.; Been, K.; Dickenson, S. Mechanical properties of a carbonate sand from a dredged hydraulic fill. Géotechnique 2018, 68, 410–420. [Google Scholar] [CrossRef]
- Jefferies, M.; Been, K. Soil Liquefaction: A Critical State Approach, 2nd ed.; Taylor & Francis; CRC Press: London, UK, 2015. [Google Scholar]
- Been, K.; Jefferies, M. Stress-dilatancy in very loose sand. Can. Geotech. J. 2004, 41, 972–989. [Google Scholar] [CrossRef]
- Torres-Cruz, L.A.; Santamarina, J.C. The critical state line of non-plastic tailings. Can. Geotech. J. 2020, 57, 1508–1517. [Google Scholar] [CrossRef]
- Carrera, A.; Coop, M.; Lancellota, R. Influence of grading on the mechanical behaviour of Stava tailings. Géotechnique 2011, 61, 935–946. [Google Scholar] [CrossRef]
- Reid, D.; Fanni, R.; Koh, K.; Orea, I. Characterisation of a subaqueously deposited silt iron ore tailings. Geotech. Lett. 2018, 8, 278–283. [Google Scholar] [CrossRef]
- Jamiolkowski, M. Soil mechanics and the observational method: Challenges at the Zelazny Most copper tailings disposal facility. Géotechnique 2014, 64, 590–618. [Google Scholar] [CrossRef] [Green Version]
- Rowe, P.W.; Barden, L. Importance of Free Ends in Triaxial Testing. J. Soil Mech. Found. Div. 1964, 90, 1–25. [Google Scholar] [CrossRef]
- Baldi, G.; Hight, D.; Thomas, G. A Reevaluation of Conventional Triaxial Test Methods. In Advanced Triaxial Testing of Soils and Rocks; Donaghe, R., Chaney, R., Silver, M., Eds.; ASTM International: West Conshohocken, PA, USA, 1988; pp. 219–263. [Google Scholar]
- Germaine, J.; Ladd, C. Triaxial Testing of Saturated Cohesive Soils. In Advanced Triaxial Testing of Soils and Rocks; Donaghe, R., Chaney, R., Silver, M., Eds.; ASTM International: West Conshohocken, PA, USA, 1988; pp. 421–459. [Google Scholar]
- Koseki, J. Several challenges in advanced laboratory testing of geomaterials with emphasis on unconventional types of liquefaction tests. Geomech. Energy Environ. 2021, 27, 100157. [Google Scholar] [CrossRef]
- Uchida, S.; Levenberg, E.; Klar, A. On-specimen strain measurement with fiber optic distributed sensing. Measurement 2015, 60, 104–113. [Google Scholar] [CrossRef]
- Viana da Fonseca, A.; Ferreira, C.; Soares, M.; Klar, A. Improved laboratory techniques for advanced geotechnical characterization towards matching in situ properties. In Six International Symposium on Deformation Characteristics of Geomaterials; Rinaldi, V.A., Zeballos, M.E., Clariá, J.J., Eds.; IOS Press: Buenos Aires, Argentina, 2015. [Google Scholar]
- Sutton, M.; Orteu, M.A.; Schreier, H. image Correlation for Shape, Motion and Deformation Measurements—Basic Concepts, Theory and Applications, 1st ed.; Springer: Berlin/Heidelberg, Germany, 2009. [Google Scholar]
- Dijkstra, J.; Broere, W. Combined full field stress and strain measurement methods for granular materials. EPJ Web Conf. 2010, 6, 22020. [Google Scholar] [CrossRef] [Green Version]
- Desrues, J.; Chambon, R.; Mokni, M.; Mazerolle, F. Void ratio evolution inside shear bands in triaxial sand specimens studied by computed tomography. Géotechnique 1996, 46, 529–546. [Google Scholar] [CrossRef]
- Oda, M.; Takemura, T.; Takahashi, M. Microstructure in shear band observed by microfocus X-ray computed tomography. Géotechnique 2004, 54, 539–542. [Google Scholar] [CrossRef]
- Sladen, J.A.; Handford, G. A potential systematic error in laboratory testing of very loose sands. Can. Geotech. J. 1987, 24, 462–466. [Google Scholar] [CrossRef]
- Ghafghazi, M.; Shuttle, D.; DeJong, J.T. Particle breakage and the critical state of sand. Soils Found. 2014, 54, 451–461. [Google Scholar] [CrossRef]
- Cho, G.-C.; Dodds, J.; Santamarina, J.C. Particle Shape Effects on Packing Density, Stiffness, and Strength: Natural and Crushed Sands. J. Geotech. Geoenviron. Eng. 2006, 132, 591–602. [Google Scholar] [CrossRef] [Green Version]
- Luzzani, L.; Coop, M.R. On the relationship between particle breakage and the critical state of sands. Soils Found. 2002, 42, 71–82. [Google Scholar] [CrossRef] [Green Version]
- Bandini, V.; Coop, M.R. The influence of particle breakage on the location of the critical state line of sands. Soils Found. 2002, 51, 591–600. [Google Scholar] [CrossRef] [Green Version]
- Yu, F.W. Particle breakage and the critical state of sands. Géotechnique 2017, 67, 713–719. [Google Scholar] [CrossRef]
- Ferreira, P.M.V.; Bica, A.V.D. Problems in identifying the effects of structure and critical state in a soil with a transitional behaviour. Géotechnique 2006, 56, 445–454. [Google Scholar] [CrossRef]
- Altuhafi, F.; Baudet, B.A.; Sammonds, P. The mechanics of subglacial sediment: An example of new “transitional” behaviour. Can. Geotech. J. 2010, 56, 775–790. [Google Scholar] [CrossRef] [Green Version]
- Xu, L.; Coop, M.R. The mechanics of a saturated silty loess with a transitional mode. Géotechnique 2017, 67, 581–596. [Google Scholar] [CrossRef] [Green Version]
- Nocilla, A.; Coop, M.R.; Colleselli, F. The mechanics of an Italian silt: An example of “transitional” behaviour. Géotechnique 2006, 67, 261–271. [Google Scholar] [CrossRef]
- Rios, S.; Ciantia, M.; Gonzalez, N.; Arroyo, M.; Viana da Fonseca, A. Simplifying calibration of bonded elasto-plastic models. Comput. Geotech. 2016, 67, 100–108. [Google Scholar] [CrossRef] [Green Version]
- Lade, P.V.; Trads, N. The role of cementation in the behaviour of cemented soils. Geotech. Res. 2014, 67, 111–132. [Google Scholar] [CrossRef] [Green Version]
- Ponzoni, E.; Nocilla, A.; Coop, M.R.; Colleselli, F. Identification and quantification of transitional modes of behaviour in sediments of Venice lagoon. Géotechnique 2014, 67, 694–708. [Google Scholar] [CrossRef]
- Verdugo, R.; Ishihara, K. The Steady State of Sandy Soils. Soils Found. 1996, 36, 81–91. [Google Scholar] [CrossRef] [Green Version]
- Li, X.S.; Wang, Y. Linear Representation of Steady-State Line for Sand. J. Geotech. Geoenviron. Eng. 1998, 124, 1215–1217. [Google Scholar] [CrossRef]
- Schnaid, F.; Bedin, J.; Viana da Fonseca, A.; de Moura Costa Filho, L. Stiffness and Strength Governing the Static Liquefaction of Tailings. J. Geotech. Geoenviron. Eng. 2013, 139, 2136–2144. [Google Scholar] [CrossRef]
- Altuhafi, F.N.; Coop, M.R.; Georgiannou, V.N. Effect of Particle Shape on the Mechanical Behavior of Natural Sands. J. Geotech. Geoenviron. Eng. 2016, 142, 04016071. [Google Scholar] [CrossRef]
- Klotz, E.U.; Coop, M.R. On the identification of critical state lines for sands. Geotech. Test. J. 2002, 25, 289–302. [Google Scholar]
- Sladen, J.A.; D’Hollander, R.D.; Krahn, J. The liquefaction of sands, a collapse surface approach. Can. Geotech. J. 1985, 22, 564–578. [Google Scholar] [CrossRef]
- Yamamuro, J.A.; Lade, P.V. Steady-State Concepts and Static Liquefaction of Silty Sands. J. Geotech. Geoenviron. Eng. 1998, 124, 868–877. [Google Scholar] [CrossRef]
- Goto, S.; Tatsuoka, F. Effects of End Conditions on IHaxial Compressive Strength for Cohesionless Soils. In Advanced Triaxial Testing of Soils and Rocks; Donaghe, R., Chaney, R., Silver, M., Eds.; ASTM International: West Conshohocken, PA, USA, 1988; pp. 692–705. [Google Scholar]
- Lade, P.V. Triaxial Testing of Soils, 1st ed.; John Wiley & Sons, Ltd.: Chichester, UK, 2016. [Google Scholar]
- Lam, W.-K.; Tatsuoka, T. Triaxial Compressive and Extension Strength of Sand Affected by Strength Anisotropy and Sample Slenderness. In Advanced Triaxial Testing of Soils and Rocks; Donaghe, R., Chaney, R., Silver, M., Eds.; ASTM International: West Conshohocken, PA, USA, 1988; pp. 655–666. [Google Scholar]
- Kolymbas, D.; Wu, W. Recent results of triaxial tests with granular materials. Powder Technol. 1990, 60, 99–119. [Google Scholar] [CrossRef]
- Ueng, T.-S.; Tzou, Y.-M.; Lee, C.-J. The Effect of End Restraint on Volume Change and Partide Breakage of Sands in THaxial Tests. In Advanced Triaxial Testing of Soils and Rocks; Donaghe, R., Chaney, R., Silver, M., Eds.; ASTM International: West Conshohocken, PA, USA, 1988; pp. 679–691. [Google Scholar]
- Reid, D.; Fourie, A.; Ayala, J.L.; Dickinson, S.; Ochoa-Cornejo, F.; Fanni, R.; Garfias, J.; da Fonseca, A.V.; Ghafghazi, M.; Ovalle, C.; et al. Results of a critical state line testing round robin programme. Géotechnique 2021, 71, 616–630. [Google Scholar] [CrossRef]
- Hettler, A.; Vardoulakis, I. Behaviour of dry sand tested in a large triaxial apparatus. Géotechnique 1984, 34, 183–630. [Google Scholar] [CrossRef]
- Viana da Fonseca, A. Load Tests on Residual Soil and Settlement Prediction on Shallow Foundation. J. Geotech. Geoenviron. Eng. 2001, 124, 868–877. [Google Scholar]
- Viana da Fonseca, A.; Pineda, J. Getting high-quality samples in ‘sensitive’ soils for advanced laboratory tests. Innov. Infrastruct. Solut. 2017, 2, 34. [Google Scholar] [CrossRef] [Green Version]
- Viana da Fonseca, A.; Ferreira, C.; Ramos, C.; Molina-Gómez, F. The geotechnical test site in the greater Lisbon area for liquefaction characterisation and sample quality control of cohesionless soils. AIMS Geosci. 2019, 5, 325–343. [Google Scholar] [CrossRef]
- Molina-Gómez, F.; Ferreira, C.; Ramos, C.; Viana da Fonseca, A. Performance of Gel-Push sampling in liquefiable soils. Geotech. Lett. 2020, 10, 256–261. [Google Scholar] [CrossRef]
- Been, K.; Jefferies, M.G.; Hachey, J. Discussion: The critical state of sands. Géotechnique 1992, 42, 655–663. [Google Scholar] [CrossRef]
- Vaid, Y.P.; Sivathayalan, S.; Stedman, D. Influence of Specimen-Reconstituting Method on the Undrained Response of Sand. Geotech. Test. J. 1999, 22, 187–195. [Google Scholar]
- Chang, N.; Heymann, G.; Clayton, C. The effect of fabric on the behaviour of gold tailings. Géotechnique 2011, 61, 187–197. [Google Scholar] [CrossRef] [Green Version]
- Reid, D.; Fanni, R. A comparison of intact and reconstituted samples of a silt tailings. Géotechnique 2020, in press. [Google Scholar] [CrossRef]
- Yamashita, S.; Kawaguchi, T.; Nakata, Y.; Mikamt, T.; Fujiwara, T.; Shibuya, S. Interpretation of international parallel test on the measurement of Gmax using bender elements. Soils Found. 2009, 49, 631–650. [Google Scholar] [CrossRef] [Green Version]
- Miranda, L.; Caldeira, L.; Serra, J.; Gomes, R.C. Dynamic behaviour of Tagus River sand including liquefaction. Bull. Earthq. Eng. 2020, 18, 4581–4604. [Google Scholar] [CrossRef]
- Molina-Gómez, F.; Viana da Fonseca, A.; Ferreira, C.; Camacho-Tauta, J. Dynamic properties of two historically liquefiable sands in the Lisbon area. Soil Dyn. Earthq. Eng. 2020, 132, 106101. [Google Scholar] [CrossRef]
- Yamamuro, J.A.; Wood, F.M. Effect of depositional method on the undrained behavior and microstructure of sand with silt. Soil Dyn. Earthq. Eng. 2004, 24, 751–760. [Google Scholar] [CrossRef]
- Ladd, R.S. Specimen preparation and cyclic stability of sands. J. Geotech. Geoenviron. Eng. 1977, 103, 535–547. [Google Scholar]
- Clayton, C.R.I. Stiffness at small strain: Research and practice. Géotechnique 2011, 61, 5–37. [Google Scholar] [CrossRef] [Green Version]
- Been, K.; Jefferies, M.G.; Hachey, J. The critical state of sands. Géotechnique 1991, 41, 365–381. [Google Scholar] [CrossRef]
- Ishihara, K. Liquefaction and flow failure during earthquakes. Géotechnique 1993, 43, 351–451. [Google Scholar] [CrossRef]
- Shipton, B.; Coop, M.R. On the compression behaviour of reconstituted soils. Soils Found. 2012, 52, 668–681. [Google Scholar] [CrossRef] [Green Version]
- Li, W.; Coop, M.R.; Senetakis, K.; Schnaid, F. The mechanics of a silt-sized gold tailing. Eng. Geol. 2018, 241, 97–108. [Google Scholar] [CrossRef] [Green Version]
- Papadimitriou, A.G.; Dafalias, Y.F.; Yoshimine, M. Plasticity modeling of the effect of sample preparation method on sand response. Soils Found. 2005, 45, 109–123. [Google Scholar] [CrossRef] [Green Version]
- Lade, P.V.; Yamamuro, J.A.; Skyers, B.D. Effects of shear band formation in triaxial extension tests. Geotech. Test. J. 1999, 19, 398–410. [Google Scholar]
- Wang, Q.; Lade, P.V. Shear Banding in True Triaxial Tests and Its Effect on Failure in Sand. J. Eng. Mech. 2001, 127, 754–761. [Google Scholar] [CrossRef]
- Wichtmann, T.; Triantafyllidis, T. An experimental database for the development, calibration and verification of constitutive models for sand with focus to cyclic loading: Part I—tests with monotonic loading and stress cycles. Acta Geotech. 2016, 11, 739–761. [Google Scholar] [CrossRef]
- Ladd, R. Preparing Test Specimens Using Undercompaction. Geotech. Test. J. 1978, 1, 16–23. [Google Scholar]
- Reid, D.; Fourie, A.; Moggach, S. Characterization of a gold tailings with hypersaline pore fluid. Can. Geotech. J. 2020, 57, 482–496. [Google Scholar] [CrossRef]
- D4767—Standard Test Method for Consolidated Undrained Triaxial Compression Test for Cohesive Soils; ASTM International: West Conshohocken, PA, USA, 2020.
- D7181—Standard Test Method for Consolidated Undrained Triaxial Compression Test for Soils; ASTM International: West Conshohocken, PA, USA, 2020.
- C702—Standard Practice for Reducing Samples of Aggregate to Testing Size; ASTM International: West Conshohocken, PA, USA, 2018.
- Thomson, P.R.; Wong, R.C.K. Specimen nonuniformities in water-pluviated and moist-tamped sands under undrained triaxial compression and extension. Can. Geotech. J. 2008, 45, 939–956. [Google Scholar] [CrossRef]
- Frost, J.D.; Park, J.Y. A critical assessment of the moist tamping technique. Geotech. Test. J. 2003, 26, 57–70. [Google Scholar]
- Ampadu, S.K.; Tatsuoka, F. Effect of setting method on the behaviour of clays in triaxial compression from saturation to undrained shear. Soils Found. 1993, 33, 14–34. [Google Scholar] [CrossRef] [Green Version]
- Skempton, A.W. The Pore-Pressure Coefficients A and B. Géotechnique 1954, 4, 143–147. [Google Scholar] [CrossRef]
- Leong, E.C.; Cheng, Z.Y. Effects of Confining Pressure and Degree of Saturation on Wave Velocities of Soils. Int. J. Geomech. 2016, 16, D4016013. [Google Scholar]
- Kokusho, T. Correlation of pore-pressure B-value with P-wave velocity and Poisson’s ratio for imperfectly saturated sand or gravel. Soils Found. 2000, 40, 95–102. [Google Scholar] [CrossRef] [Green Version]
- Kumar, J.; Madhusudhan, B.N. Dynamic properties of sand from dry to fully saturated states. Géotechnique 2012, 62, 45–54. [Google Scholar] [CrossRef]
- Viana da Fonseca, A.; Ferreira, C.; Fahey, M. A Framework Interpreting Bender Element Tests, Combining Time-Domain and Frequency-Domain Methods. Geotech. Test. J. 2009, 32, 100974. [Google Scholar]
- Ferreira, C.; Díaz-Durán, F.; Viana da Fonseca, A.; Cascante, G. New approach to concurrent Vs and Vp measurements using bender elements. Geotech. Test. J. 2021, accepted. [Google Scholar]
- Santamarina, J.C.; Klein, K.A.; Fam, M.A. Soils and Waves, 1st ed.; ohn Wiley & Sons, Ltd.: Chichester, UK, 2001. [Google Scholar]
- Yang, J. Liquefaction resistance of sand in relation to P-wave velocity. Géotechnique 2002, 52, 295–298. [Google Scholar] [CrossRef]
- Yoshimi, Y.; Tanaka, K.; Tokimatsu, K. Liquefaction resistance of a partially saturated sand. Soils Found. 1989, 52, 295–298. [Google Scholar] [CrossRef] [Green Version]
- Tsukamoto, Y.; Ishihara, K.; Nakazawa, H.; Kamada, K.; Huang, Y. Resistance of partly saturated sand to liquefaction with reference to longitudinal and shear wave velocities. Soils Found. 2002, 42, 93–104. [Google Scholar] [CrossRef] [Green Version]
- Tamura, S.; Tokimatsu, K.; Abe, A.; Sato, M. Effects of air bubbles on B-value and P-wave velocity of a partly saturated sand. Soils Found. 2002, 42, 121–129. [Google Scholar] [CrossRef] [Green Version]
- Emerson, M.; Foray, P. Laboratory P-wave measurements in dry and saturated sand. Acta Geotech. 2006, 1, 167–177. [Google Scholar] [CrossRef]
- Biot, M.A. Theory of Propagation of Elastic Waves in a Fluid-Saturated Porous Solid I. Low-Frequency Range. J. Acoust. Soc. Am. 1956, 28, 168–178. [Google Scholar] [CrossRef]
- Biot, M.A. Theory of Propagation of Elastic Waves in a Fluid-Saturated Porous Solid II. Higher Frequency Range. J. Acoust. Soc. Am. 1956, 28, 179–191. [Google Scholar] [CrossRef]
- Molina-Gómez, F.; Viana da Fonseca, A. Key geomechanical properties of the historically liquefiable TP-Lisbon sand. Soils Found. 2021, in press. [Google Scholar] [CrossRef]
- Head, K.H. Manual of Soil Laboratory Testing—Volume 2—Permeability, shear strength and compressibility tests, 3rd ed.; Pentech Press Limited: London, UK, 2006. [Google Scholar]
- Nicholson, P.G.; Seed, R.B.; Anwar, H.A. Elimination of membrane compliance in undrained triaxial testing. I. Measurement and evaluation. Can. Geotech. J. 1993, 30, 727–738. [Google Scholar] [CrossRef]
- Delgado, B.G.; Viana da Fonseca, A.; Fortunato, E.; Maia, P. Mechanical behavior of inert steel slag ballast for heavy haul rail track: Laboratory evaluation. Transp. Geotech. 2019, 20, 100243. [Google Scholar] [CrossRef]
- Duncan, J.M.; Seed, H.B. Errors in Strenght Tests and Recommended Corrections; Institute of Transportation Studies, University of California Berkeley: Berkley, CA, USA, 1965. [Google Scholar]
- Duncan, J.M.; Seed, H.B. Corrections for Strength Test Data. J. Soil Mech. Found. Div. 1967, 93, 121–137. [Google Scholar] [CrossRef]
- Fourie, A.B.; Papageorgiou, G. Defining an appropriate steady state line for Merriespruit gold tailings. Can. Geotech. J. 2001, 38, 695–706. [Google Scholar] [CrossRef]
- Santos, J.A.; Gomes, R.C.; Lourenço, J.C.; Marques, F.; Coelho, P.; Azeiteiro, R.; Santos, L.A.; Marques, V.; da Fonseca, A.V.; Soares, M.; et al. Coimbra Sand—Round Robin tests to evaluate liquefaction resistance. In Proceedings of the 15th World Conference on Earthquake Engineering, Lisbon, Portugal, 24–28 September 2012. [Google Scholar]
- Azeiteiro, R.J.N.; Coelho, P.A.L.F.; Taborda, D.M.G.; Grazina, J.C.D. Critical State–Based Interpretation of the Monotonic Behavior of Hostun Sand. J. Geotech. Geoenviron. Eng. 2017, 143, 04017004-1–04017004-14. [Google Scholar] [CrossRef]
Short Biography of Authors
 | António Viana da Fonseca PhD, Professor in Geotechnical Engineering in the Civil Engineering Department at the University of Porto (FEUP), Director of the Geotechnical Laboratory. His expertise has focus in advanced experimental soil mechanics and modelling of natural and artificial soils, including non-conventional materials, such as mine tailings. He is the Chairman of ISSMGE TC-102, “Ground Property Characterization by In-Situ Tests”, 2013–2021. He is a fellow and former President of the College of Geotechnical Specialists of the Portuguese Institution of Engineers. He is a consultant and practitioner specialising in the areas of lab and in situ testing of soils, foundations and deep excavations of soil structure interaction analyses and earthquake design of geotechnical structures, including soil liquefaction induced damages and mitigation. He is also an advisor for the risk assessment and safety improvement of more than 50 tailings dams in Brazil; among other research projects, he serves for the H2020 project LIQUEFACT, leading the WP: “Structural liquefaction resilience and vulnerability assessment methodologies”. |
 | Diana Cordeiro, MSc, is a researcher in CONSTRUCT-GEO of the Faculdade de Engenharia da Universidade do Porto (FEUP), Portugal. She received her master’s degree in Civil Engineering from FEUP in 2018 with an emphasis in Geotechnics. Her experimental work on LabGEO (at FEUP) began with her master’s project on desaturation as an effective measure of liquefaction mitigation followed by a scholarship for the research project LIQ2PROEARTH, assessing liquefaction susceptibility throughout in situ and laboratory tests. Currently, her main research is focused on the geomechanical behaviour of tailing materials within the critical state framework by laboratory testing. |
 | Fausto Molina-Gómez is a PhD researcher in CONSTRUCT-GEO of the Faculdade de Engenharia da Universidade do Porto (FEUP), Portugal. He received his BScEng in Civil Engineering in 2014 from the Universidad Militar Nueva Granada (Colombia) and his MSc in Civil Engineering with an emphasis in Geotechnics in 2016 from the Universidad de los Andes (Colombia). His research interests and expertise are in geomechanics, geotechnical earthquake engineering (in particular, problems associated with liquefaction), soil testing, wave propagation, critical state soil mechanics and statistical data interpretation. |
Figure 1.
Schematic illustration of the CSL of transitional soils and conventional soils.

Figure 2.
Schematic illustration of the non-linearity of CSL.

Figure 3.
Oversized lubricated end platens for triaxial tests: (a) photo with the implemented configuration; (b) lateral view scheme.
Figure 3.
Oversized lubricated end platens for triaxial tests: (a) photo with the implemented configuration; (b) lateral view scheme.

Figure 4.
Comparison of sample shape at the end of triaxial shearing: (a) lubricated end platens; (b) non-lubricated end platens.
Figure 4.
Comparison of sample shape at the end of triaxial shearing: (a) lubricated end platens; (b) non-lubricated end platens.

Figure 5.
Examples of alignment between the loading ram piston and the specimen axis: (a) misalignment by bad positioning; (b) misalignment due to tilting; (c) perfect alignment.
Figure 5.
Examples of alignment between the loading ram piston and the specimen axis: (a) misalignment by bad positioning; (b) misalignment due to tilting; (c) perfect alignment.

Figure 6.
Horizontal alignment between loading ram and top end platen: (a) non-horizontality of the platen surfaces; (b) horizontality of the platen surfaces due to spherical caps; (c) photo with the implemented configuration.
Figure 6.
Horizontal alignment between loading ram and top end platen: (a) non-horizontality of the platen surfaces; (b) horizontality of the platen surfaces due to spherical caps; (c) photo with the implemented configuration.

Figure 7.
Connection of the load cell to the top platen through a suction cap: (a) parts and scheme; (b) photo with the implemented configuration.
Figure 7.
Connection of the load cell to the top platen through a suction cap: (a) parts and scheme; (b) photo with the implemented configuration.

Figure 8.
Embedded top-cap loading ram connection: (a) parts and scheme; (b) implementation in the triaxial apparatus; (c) individual components of the proposed method.
Figure 8.
Embedded top-cap loading ram connection: (a) parts and scheme; (b) implementation in the triaxial apparatus; (c) individual components of the proposed method.

Figure 9.
Elements for specimen remoulding: (a) split compaction mould; (b) compaction hammer.

Figure 10.
Irregular remoulding: (a) ‘mushroom’ effect; (b) localised shear bands on soil specimen.

Figure 11.
Reconstitution of soil specimens: (a) layer deposition; (b) tamping process; (c) isolation of the sample; (d) fully remoulded sample.
Figure 11.
Reconstitution of soil specimens: (a) layer deposition; (b) tamping process; (c) isolation of the sample; (d) fully remoulded sample.

Figure 12.
Soil specimens after remoulding: (a) specimen with a ‘zig-zag’ pattern; (b) regular specimen.
Figure 12.
Soil specimens after remoulding: (a) specimen with a ‘zig-zag’ pattern; (b) regular specimen.

Figure 13.
Application of the wave propagation theory to validate the degree of saturation: (a) as a function of ; (b) B-value as a function of ; (c) relation between B-value with .
Figure 13.
Application of the wave propagation theory to validate the degree of saturation: (a) as a function of ; (b) B-value as a function of ; (c) relation between B-value with .

Figure 14.
Grading curves of the studied soils.

Figure 15.
Reproducibility of tests: (a) comparison of deviatoric stresses; (b) comparison of mean effective stresses; (c) comparison of void ratios.
Figure 15.
Reproducibility of tests: (a) comparison of deviatoric stresses; (b) comparison of mean effective stresses; (c) comparison of void ratios.

Figure 16.
Comparisons of normalised behaviour: (a,b) stress ratio and volumetric strain of paired tests of gold tailing for kPa; (c,d) stress ratio and volumetric strain of paired tests of TP-Lisbon sand for kPa; (e,f) stress ratio and volumetric strain of paired tests of gold tailing for kPa; (g,h) stress ratio and volumetric strain of paired tests of Coimbra sand for kPa; (i,j) stress ratio and volumetric strain of paired tests of Hostun sand for kPa.


Figure 17.
Behavioural consistency of undrained tests.

Figure 18.
Inferred critical state and comparison of test-paths between testing procedures.

Figure 19.
Comparisons of undrained behaviour obtained using different triaxial configurations: (a) kPa; (b) kPa.
Figure 19.
Comparisons of undrained behaviour obtained using different triaxial configurations: (a) kPa; (b) kPa.


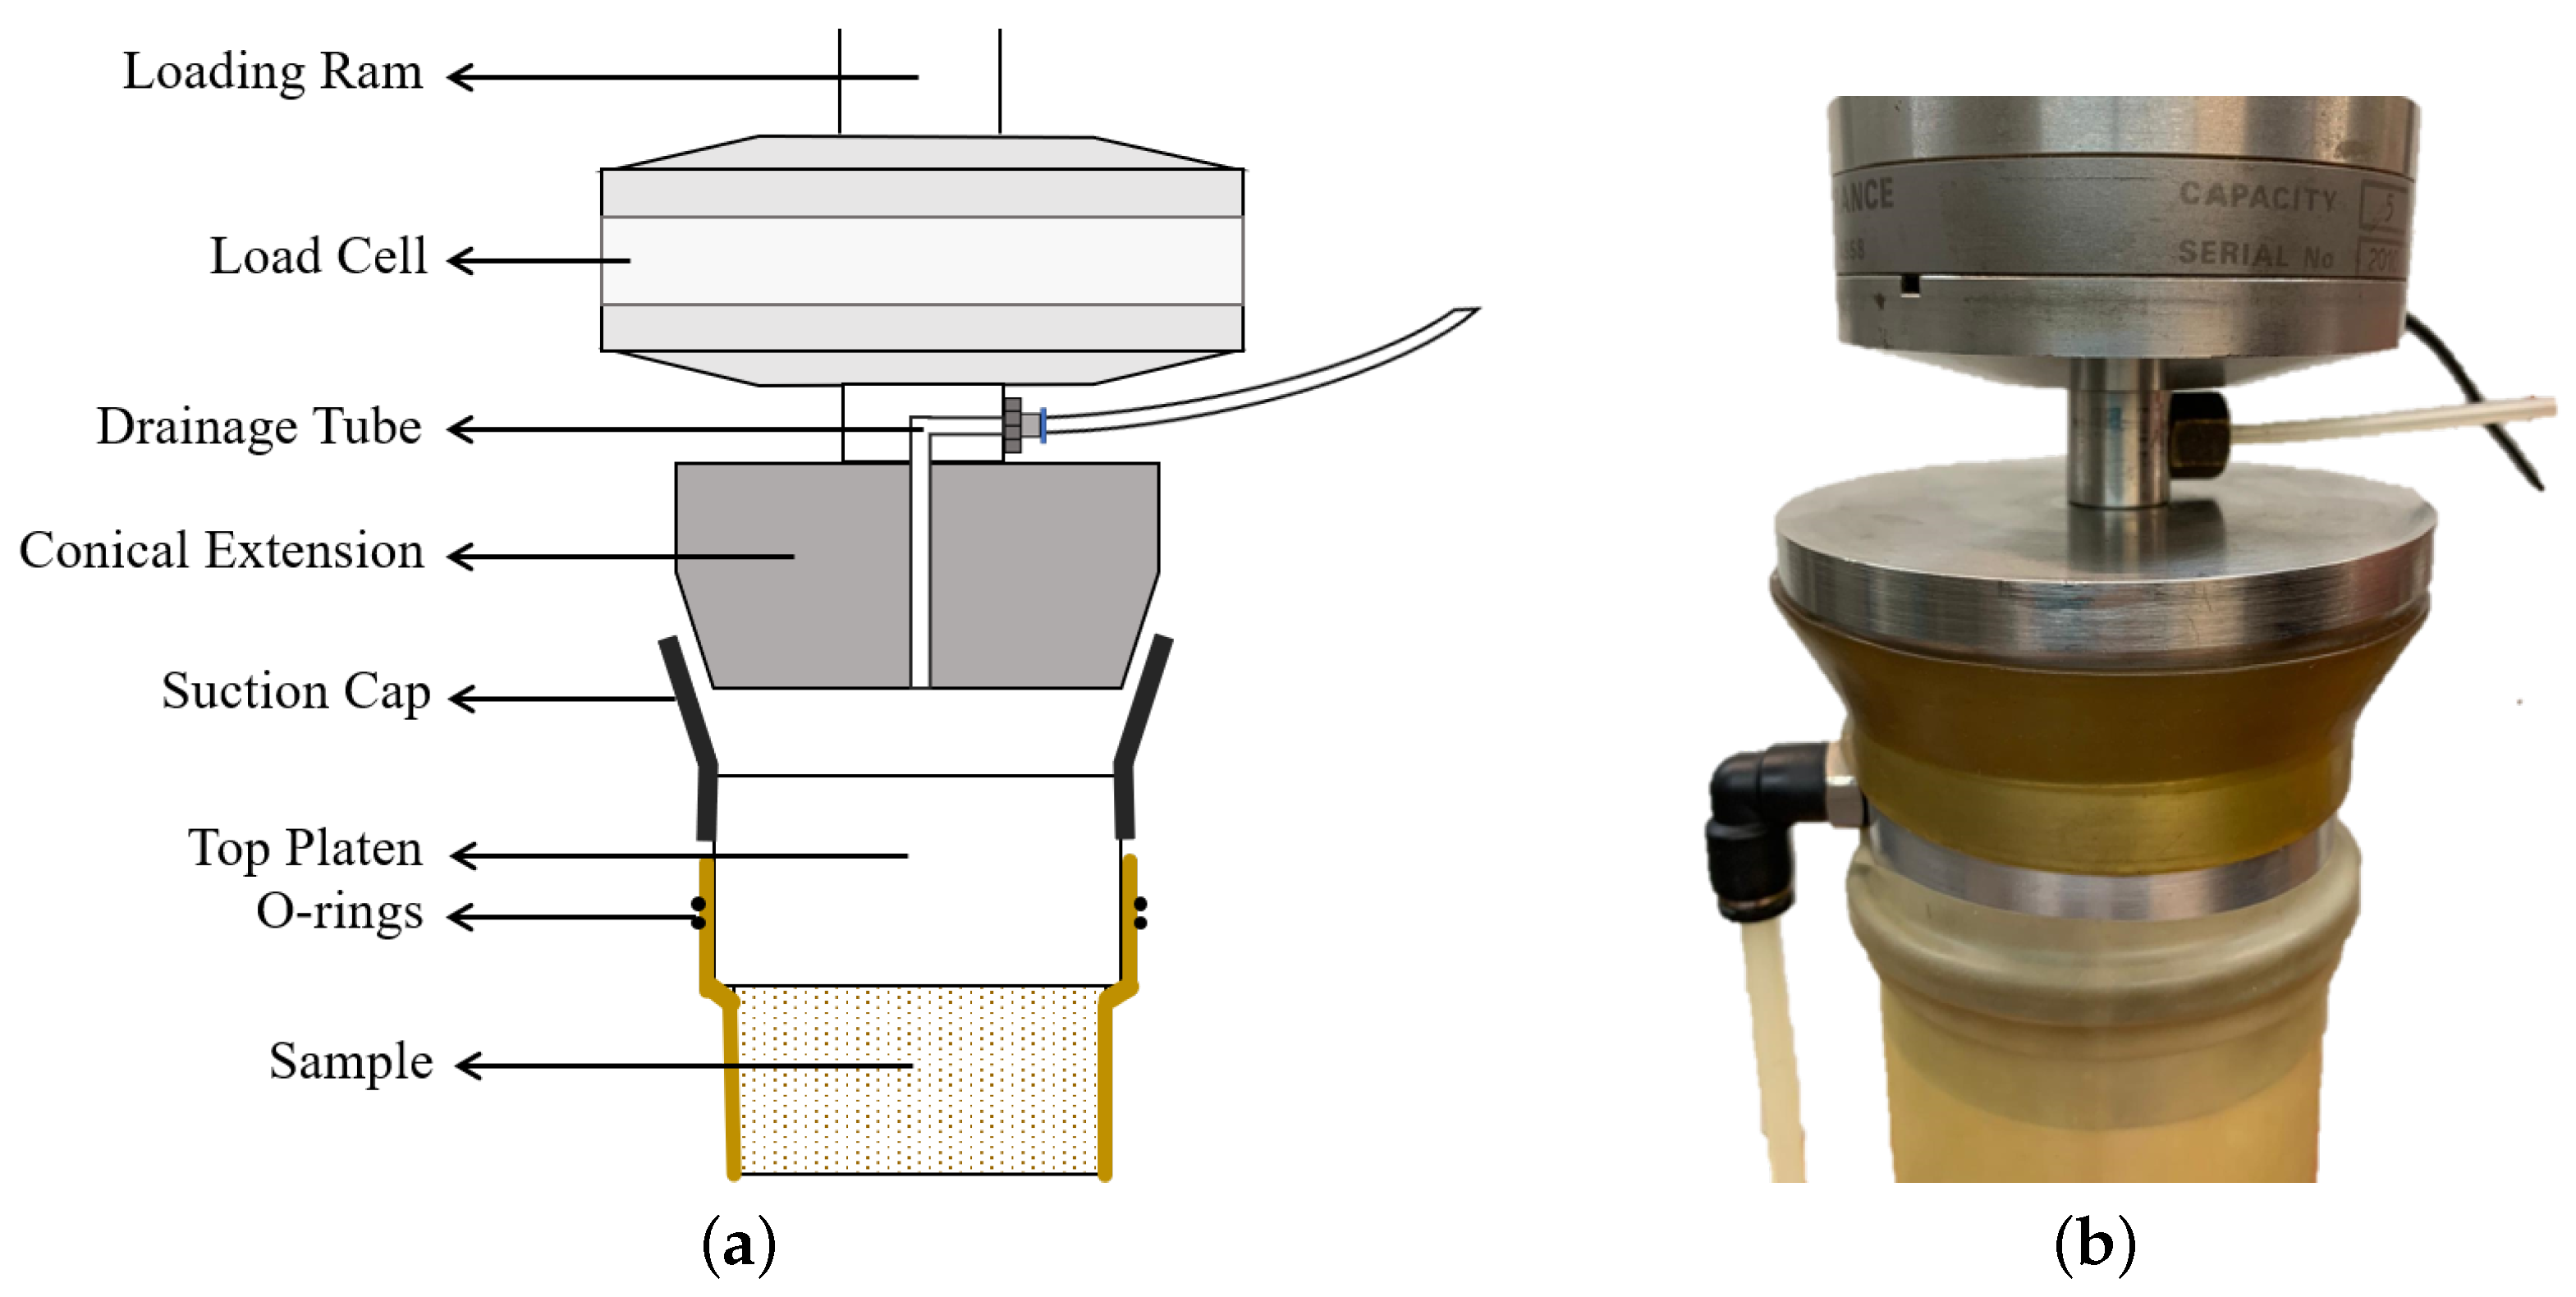
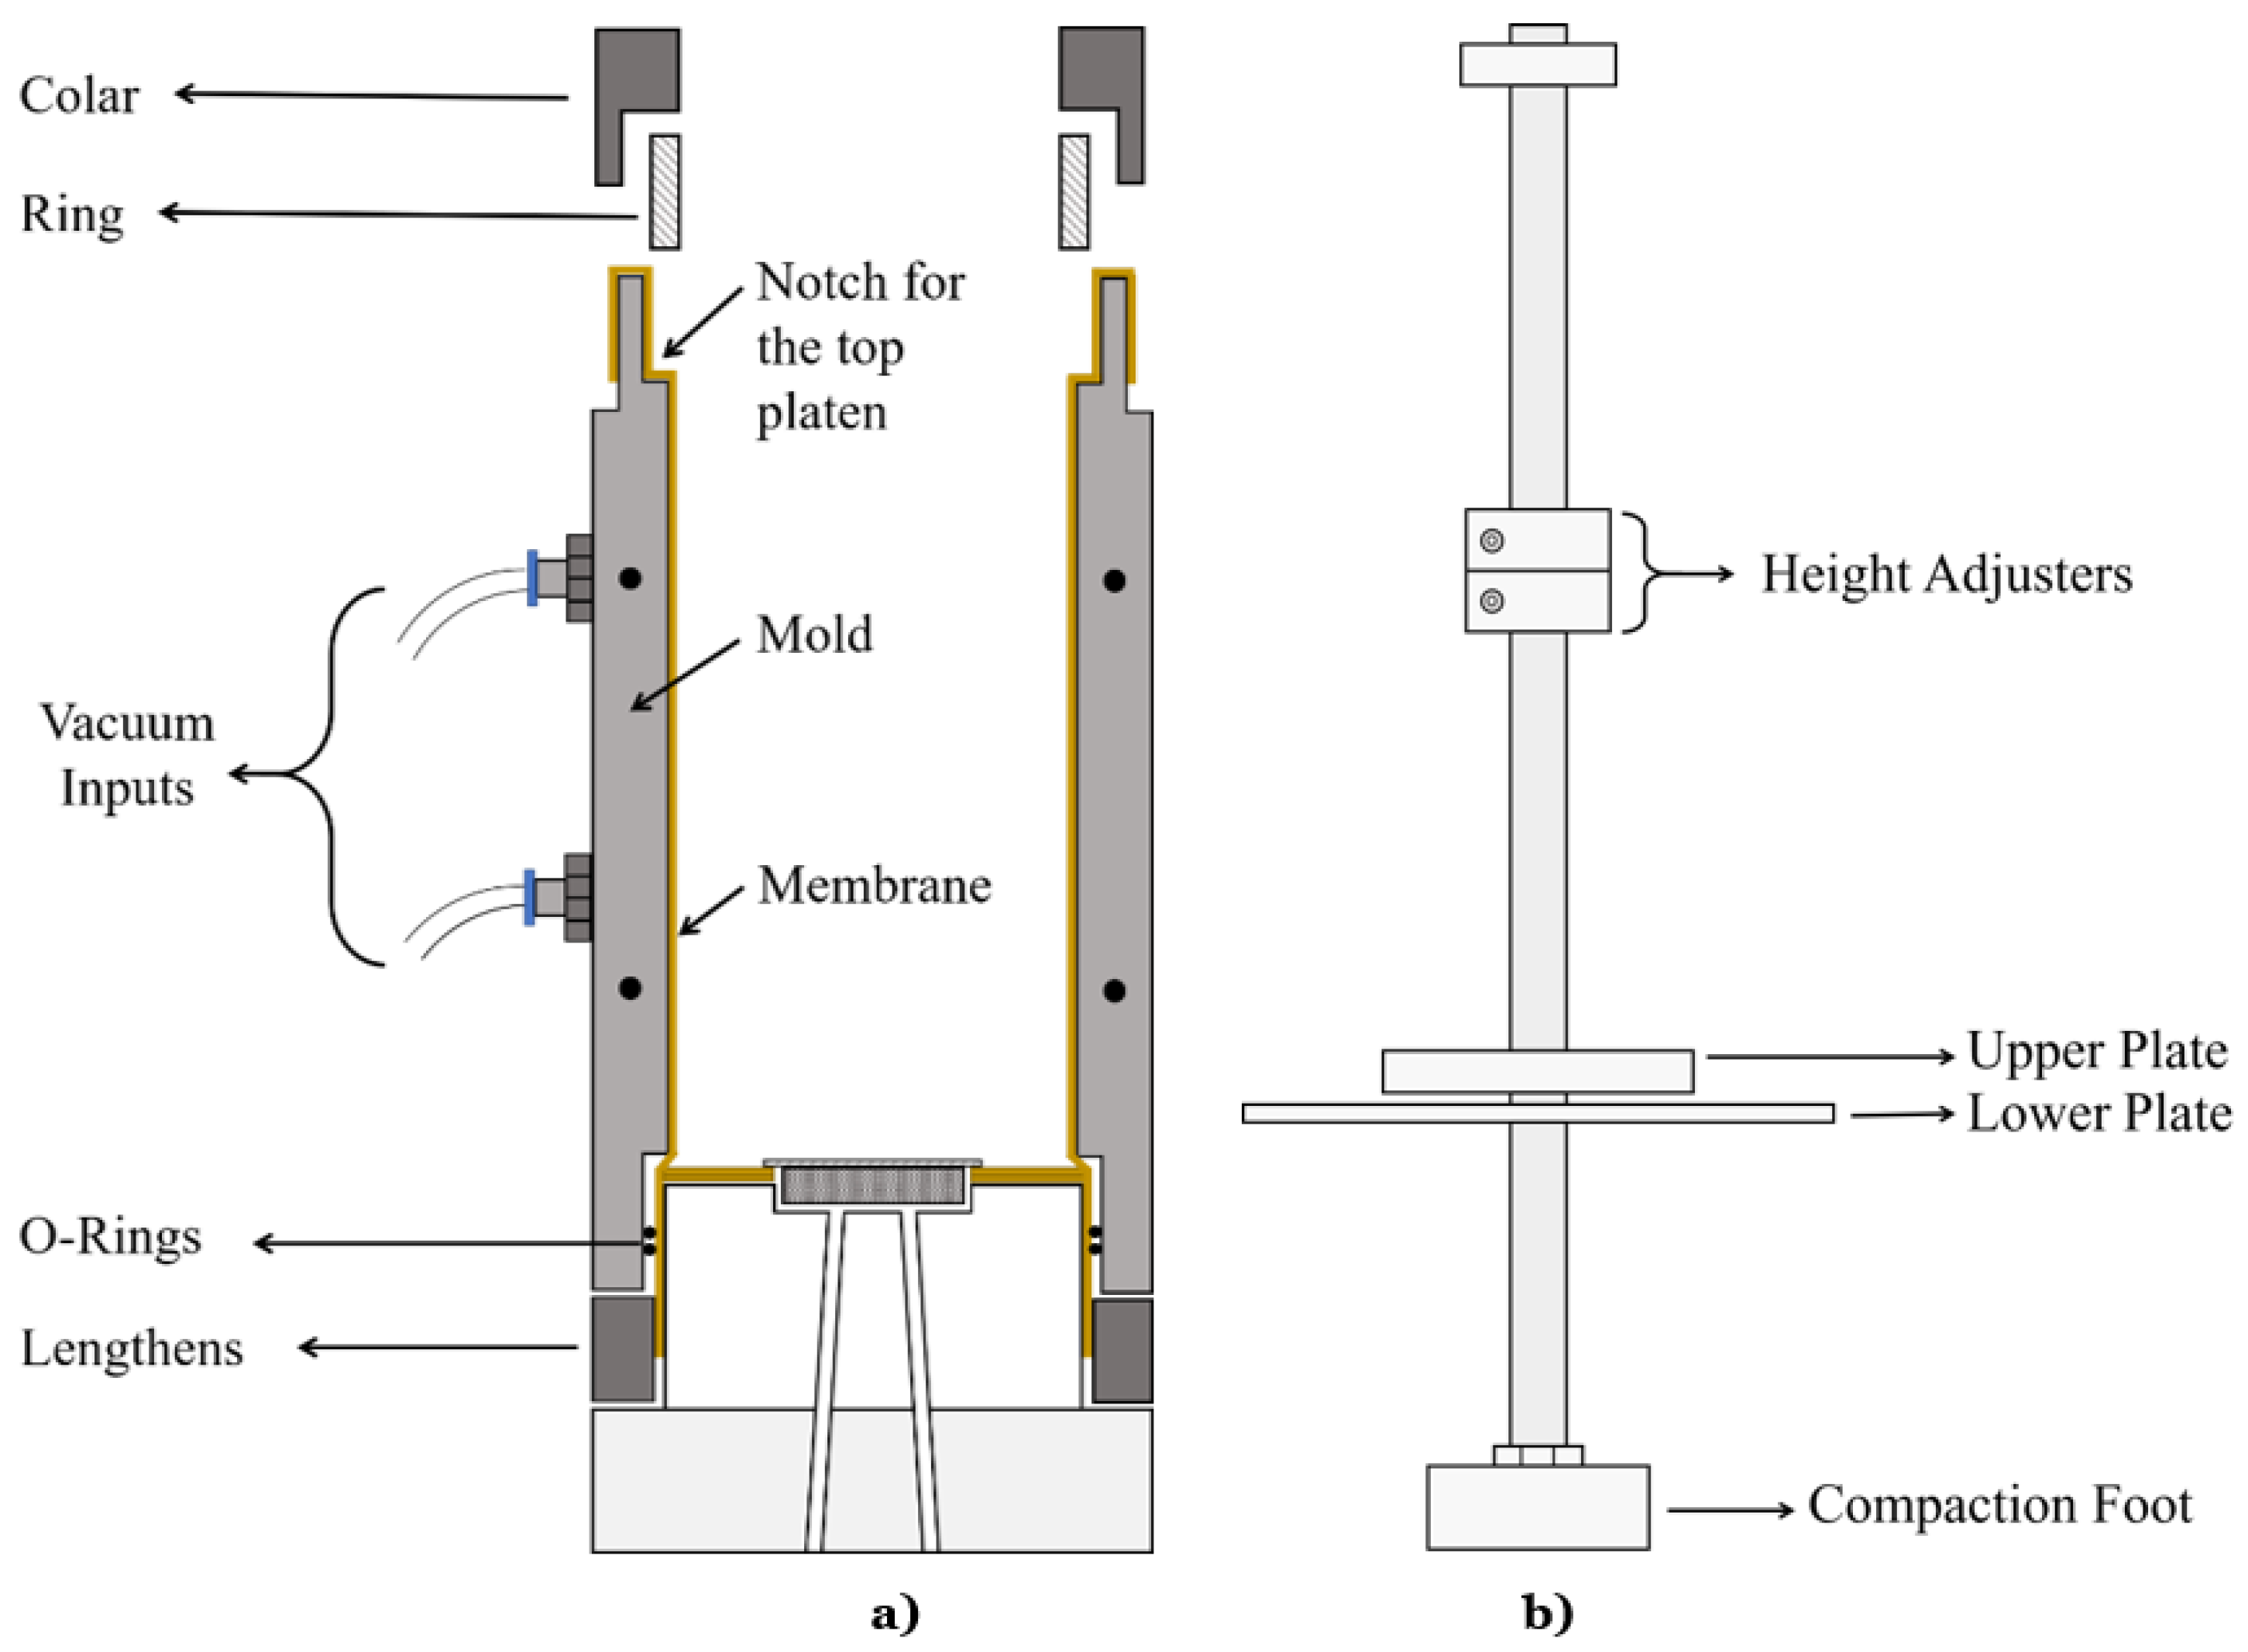
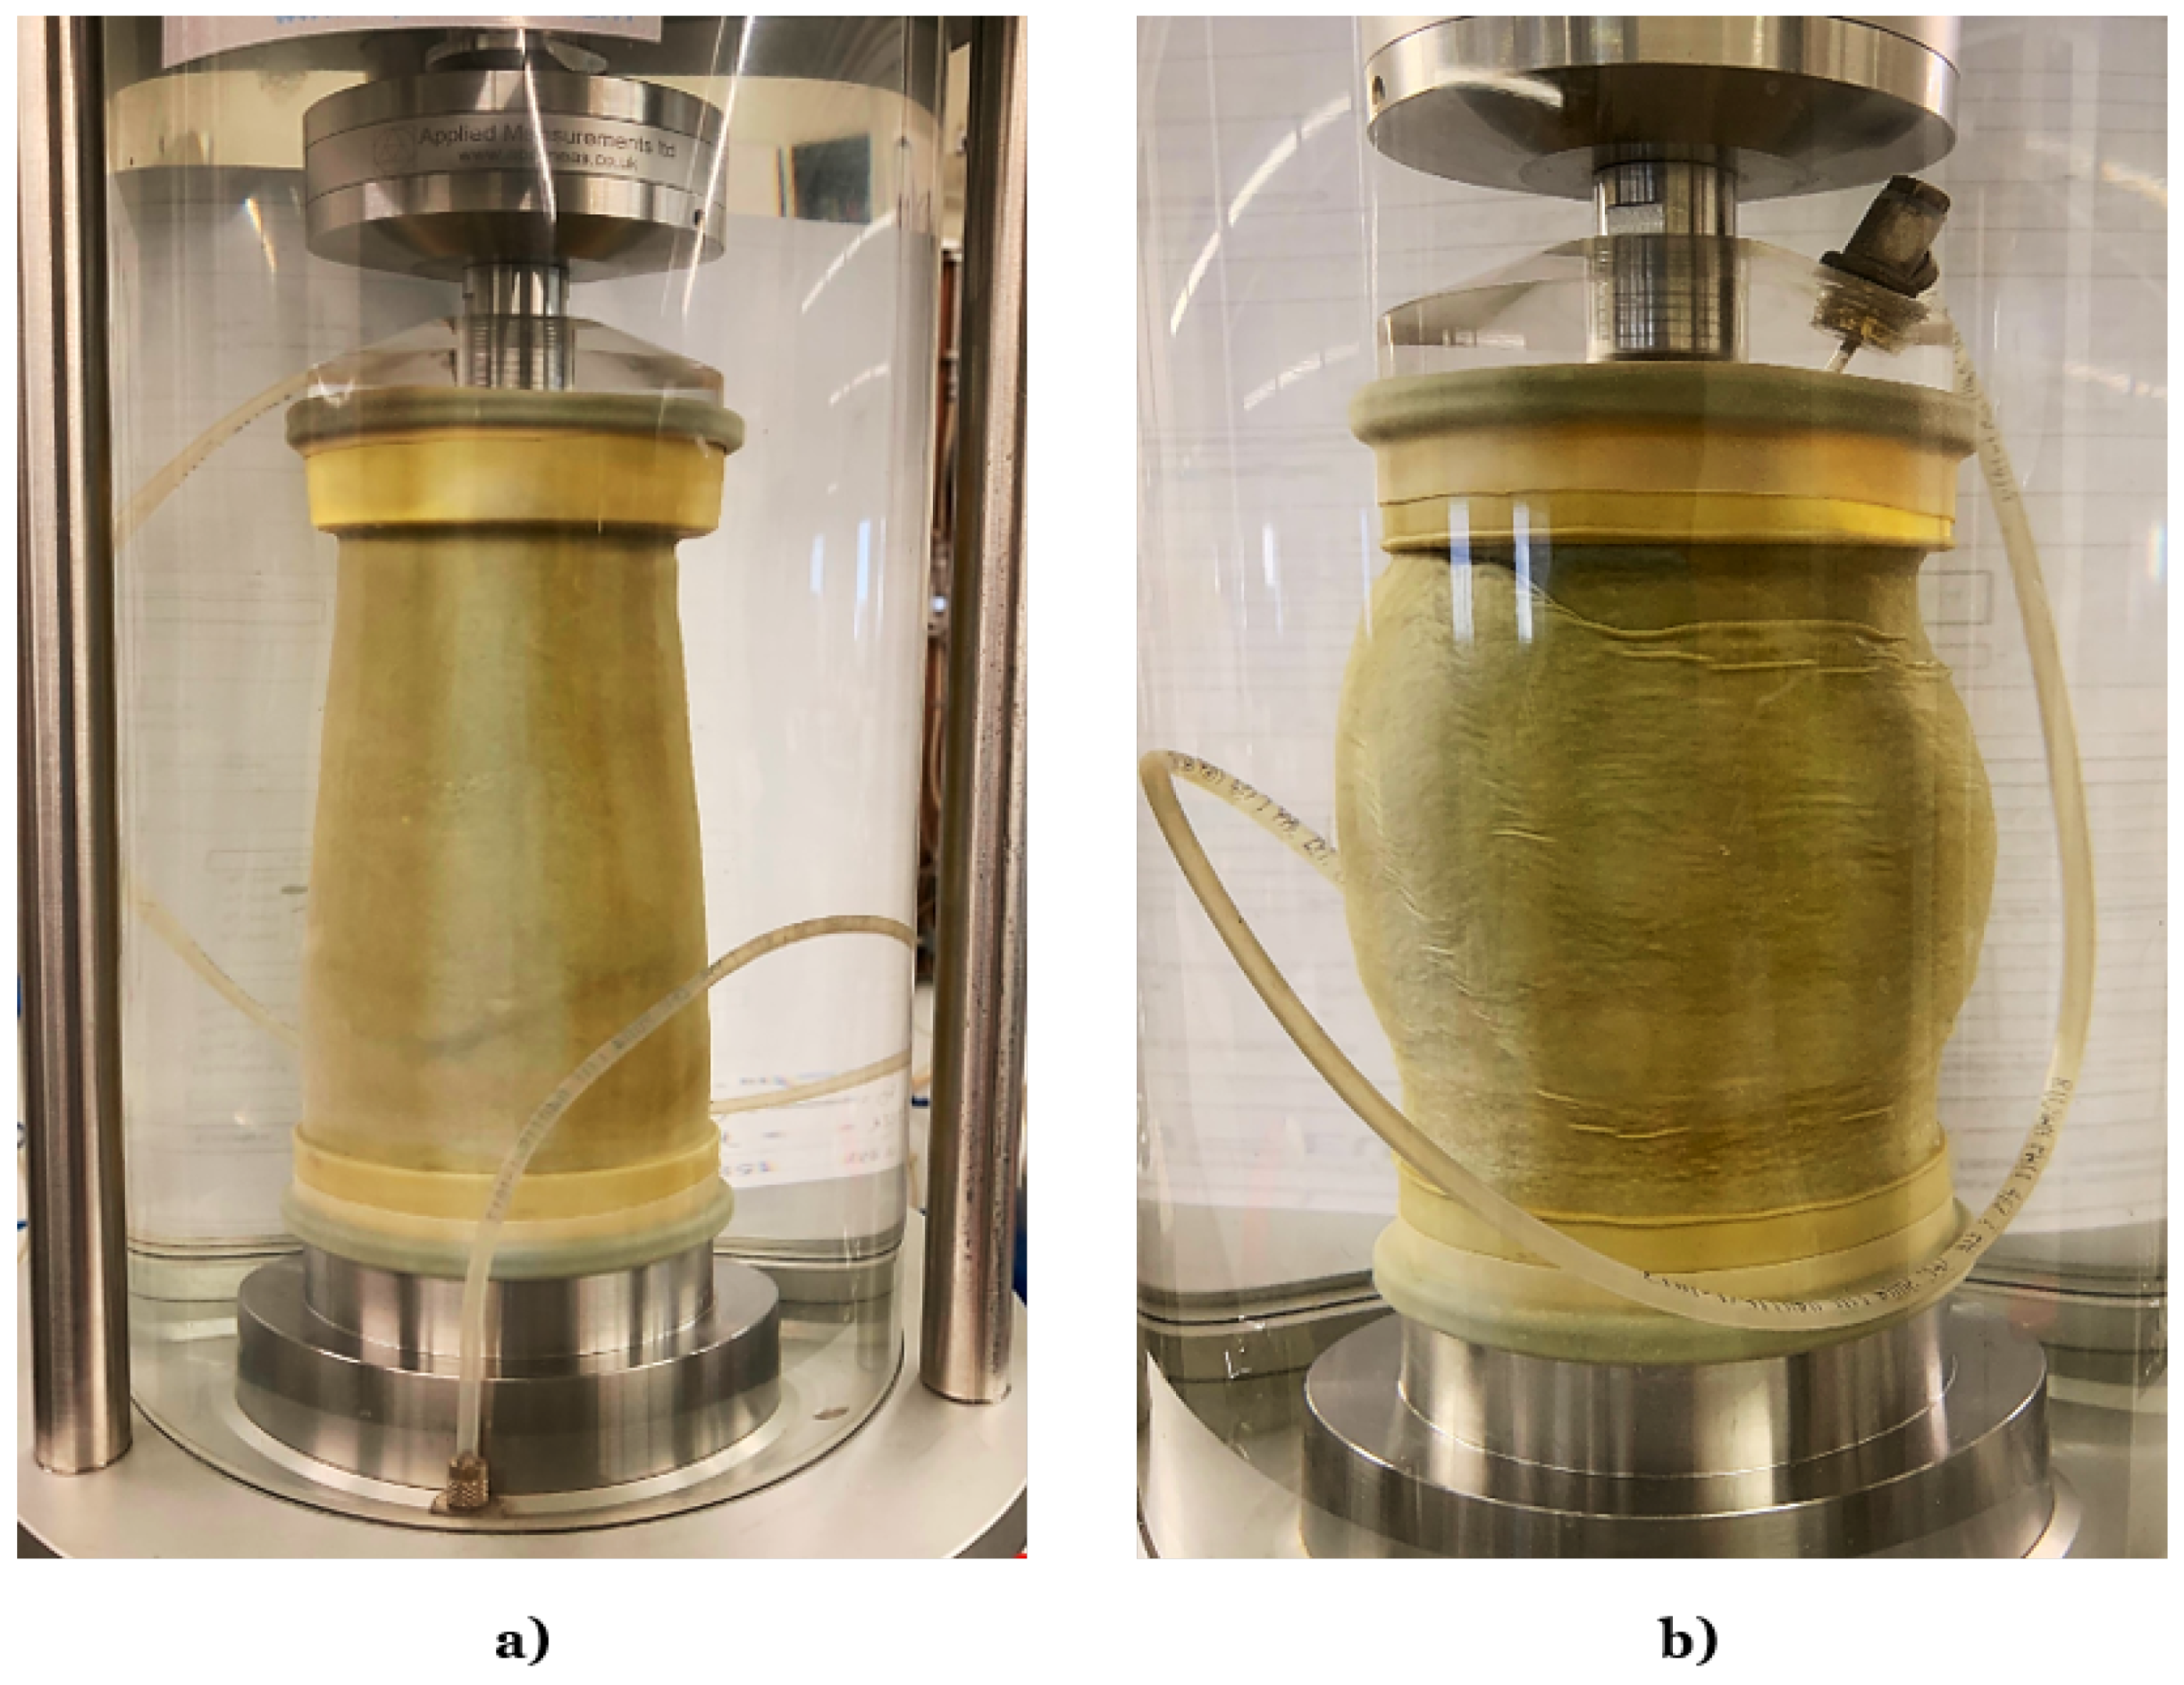
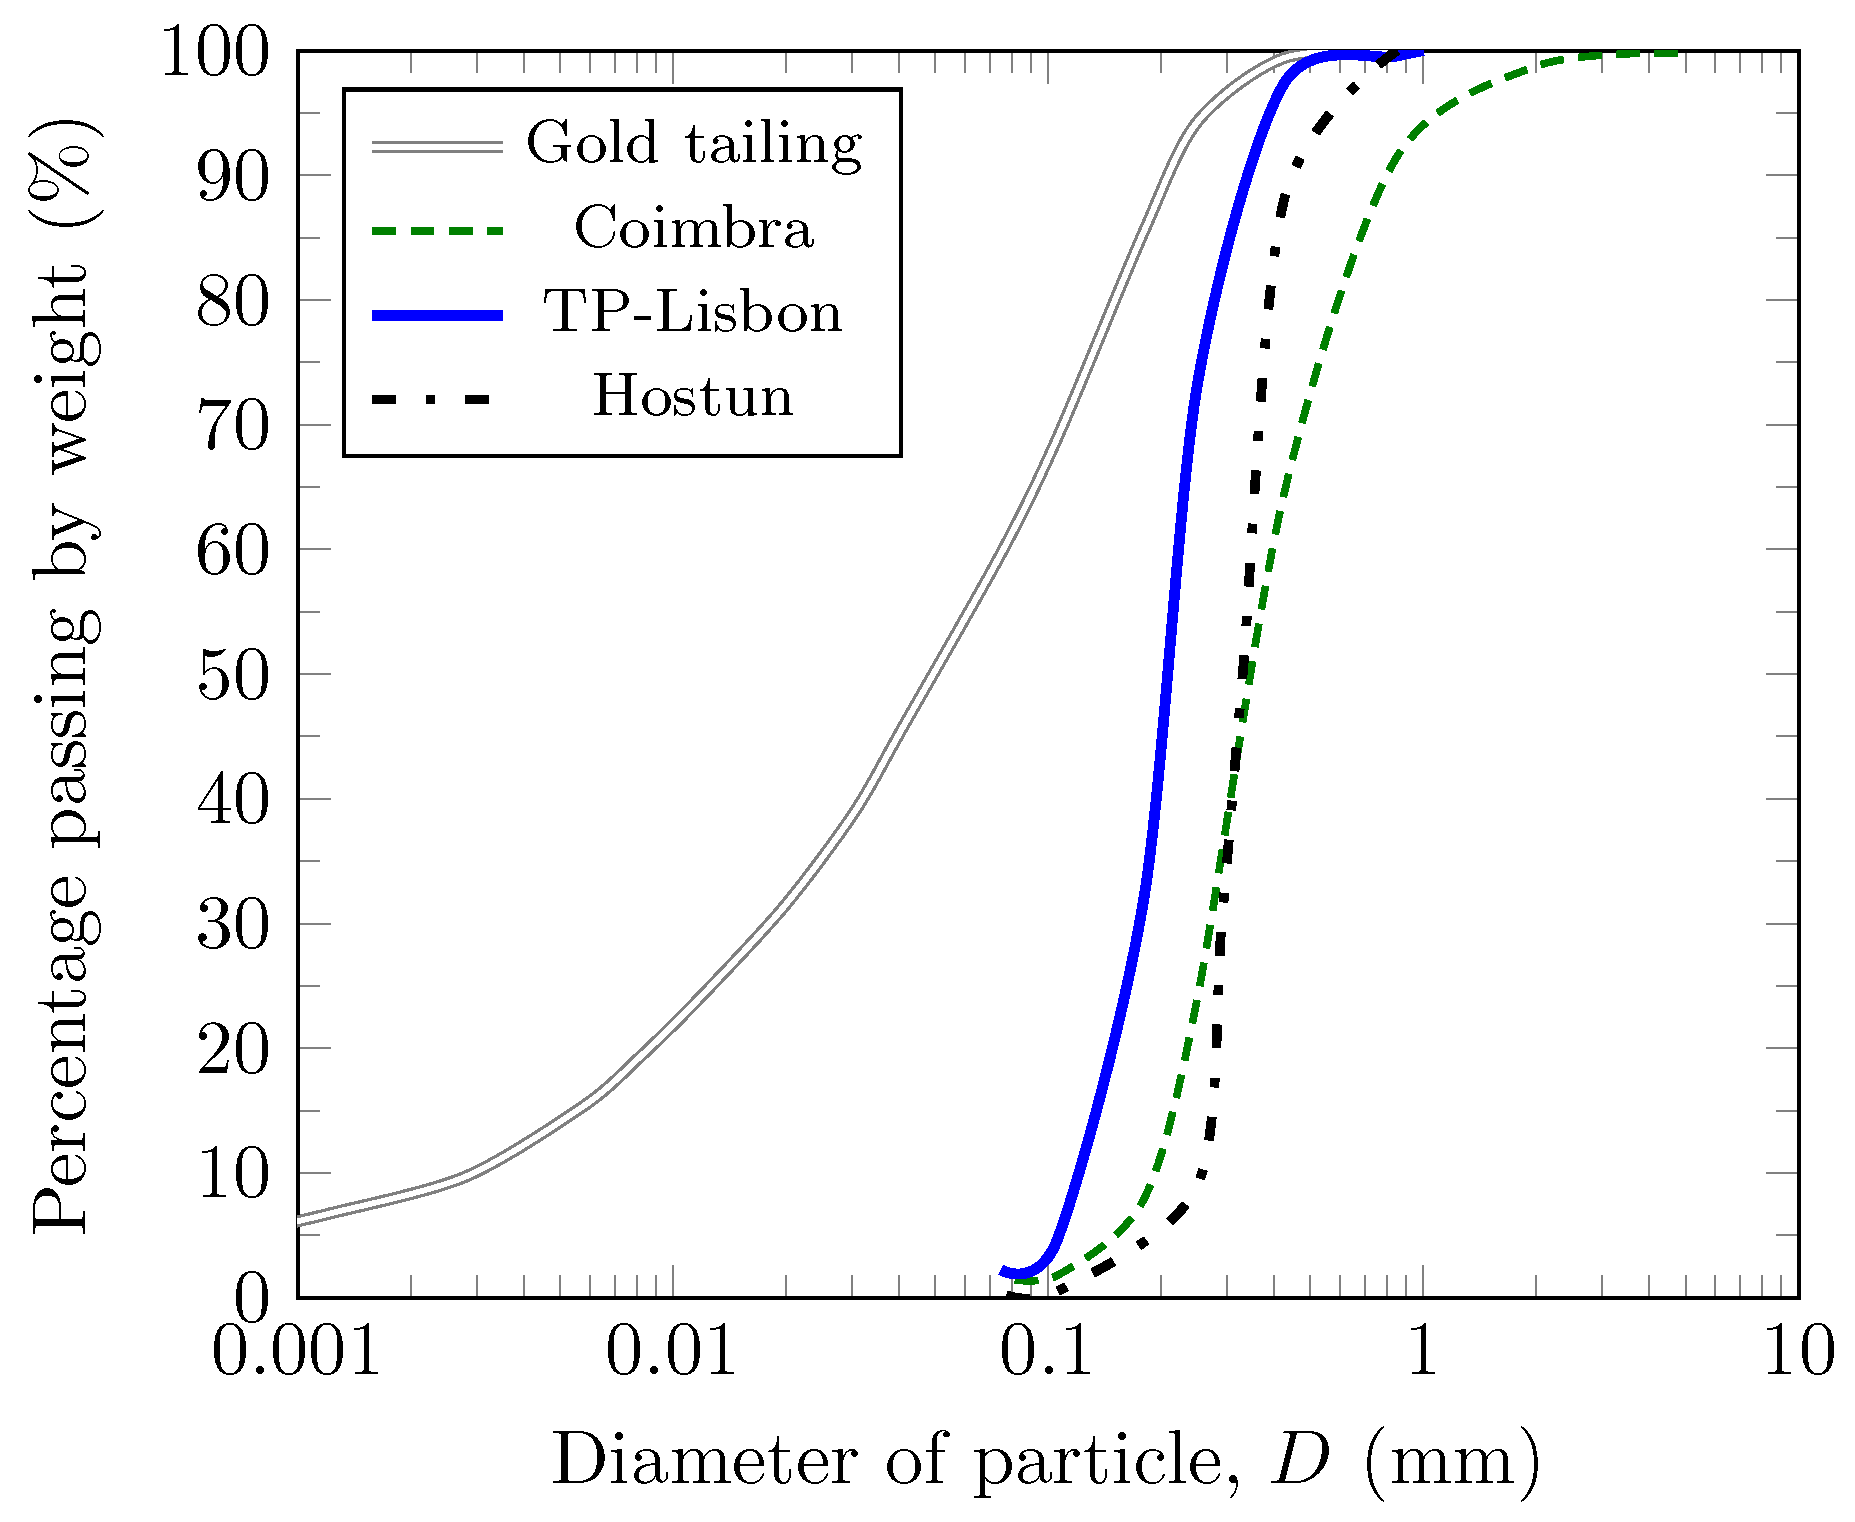
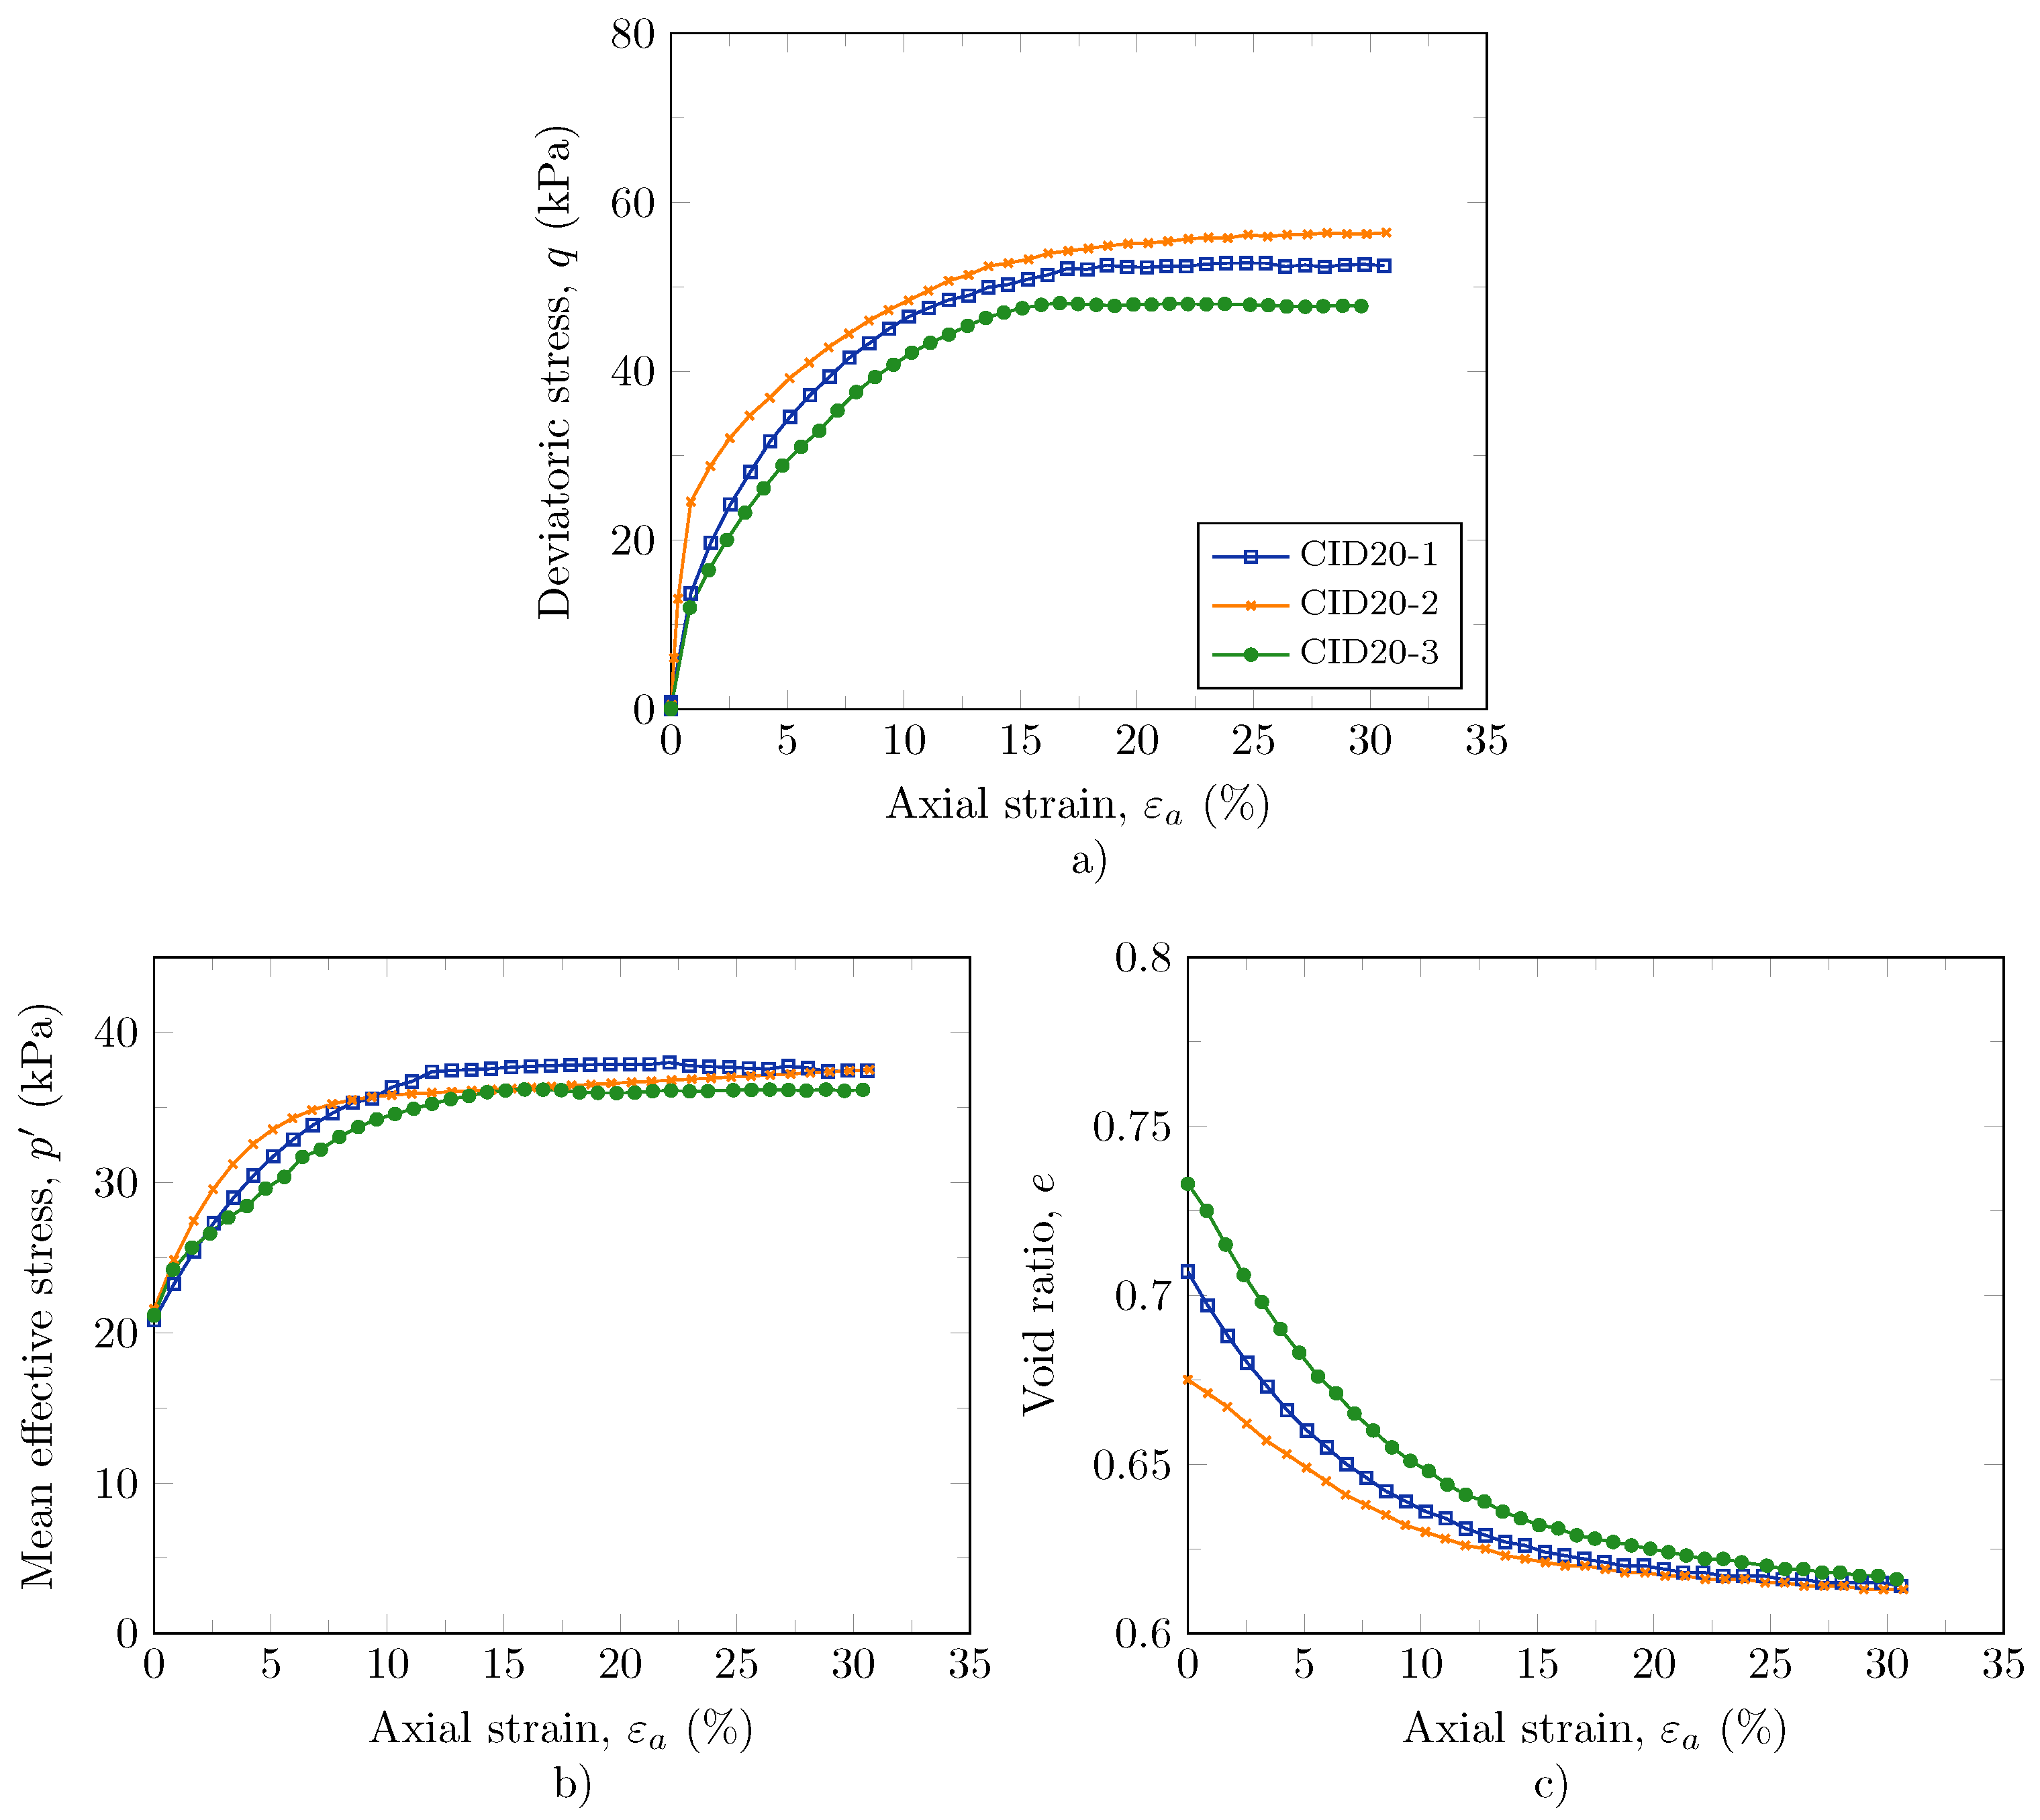
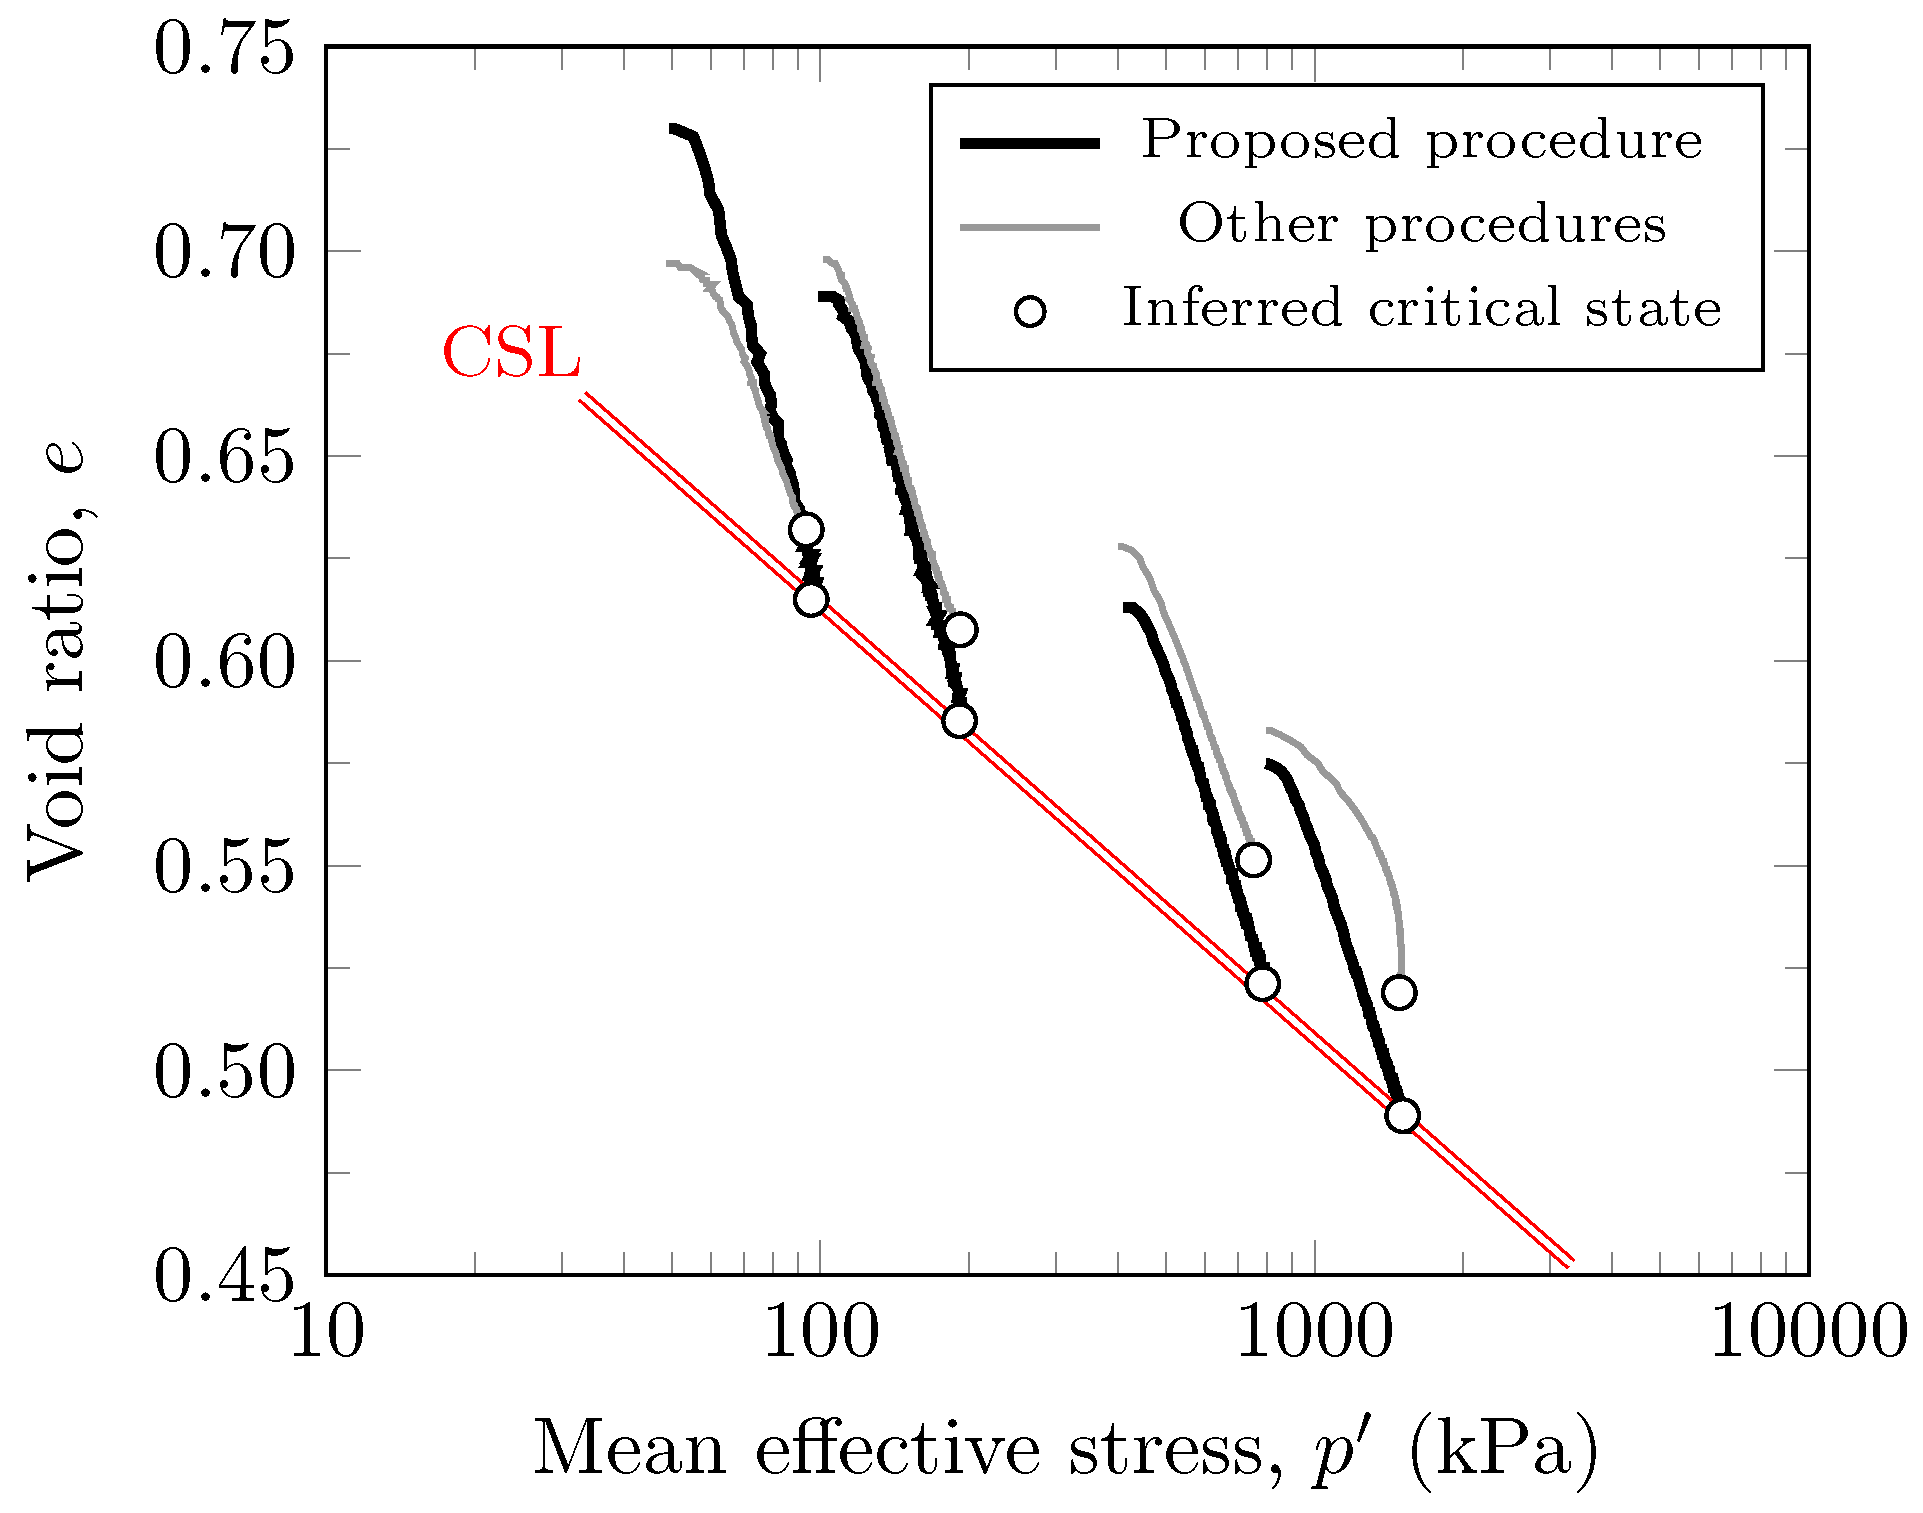
Table 1.
Physical properties of studied soils.
| Studied | Gs | Fines | Cc | Cu | Shape of | |||
|---|---|---|---|---|---|---|---|---|
| Soil | ( – ) | (mm) | Content (%) | ( – ) | ( – ) | ( – ) | ( – ) | Particles |
| Gold tailing | 2.78 | 0.05 | 58.75 | 1.44 | 25 | 1.45 | 0.39 | Sub-rounded |
| Coimbra | 2.65 | 0.28 | 1.80 | 1.37 | 1.69 | 0.81 | 0.48 | Sub-rounded |
| TP-Lisbon | 2.66 | 0.21 | 2.21 | 1.13 | 2.13 | 1.01 | 0.63 | Sub-angular |
| Hostun | 2.64 | 0.34 | 0.00 | 0.96 | 1.43 | 1.00 | 0.66 | Sub-angular |
Table 2.
Physical properties of studied soils.
| Laboratory | Shearing | LEP | Top-cap | ||
|---|---|---|---|---|---|
| Conditions | (kPa) | ( – ) | LRC | ||
| UPorto | Drained | 50 | 0.73 | yes | yes |
| Drained | 100 | 0.689 | yes | yes | |
| Drained | 400 | 0.613 | yes | yes | |
| Drained | 800 | 0.575 | yes | yes | |
| Undrained | 200 | 0.659 | yes | yes | |
| Undrained | 200 | 0.632 | no | yes | |
| Undrained | 800 | 0.578 | yes | yes | |
| Undrained | 800 | 0.566 | no | yes | |
| UWA | Drained | 100 | 0.698 | yes | no |
| Golder-P | Undrained | 200 | 0.67 | yes | no |
| Golder-V | Drained | 50 | 0.697 | yes | no |
| Undrained | 800 | 0.592 | yes | no | |
| BGC | Drained | 400 | 0.628 | yes | no |
| KCB | Drained | 400 | 0.628 | yes | no |
Note: is mean effective stress after consolidation; is void ratio after consolidation; LEP is lubricated end platens. LRC is loading ram connection.
Table 3.
Final point values of paired triaxial tests.
| Test Identification | Proposed Methods | Other Methods | ||
|---|---|---|---|---|
| Using in kPa | (kPa) | ( – ) | (kPa) | ( – ) |
| 50 | 96 | 0.616 | 94 | 0.632 |
| 100 | 191 | 0.585 | 191 | 0.608 |
| 400 | 785 | 0.521 | 752 | 0.551 |
| 800 | 1507 | 0.489 | 1483 | 0.524 |
Publisher’s Note: MDPI stays neutral with regard to jurisdictional claims in published maps and institutional affiliations. |
© 2021 by the authors. Licensee MDPI, Basel, Switzerland. This article is an open access article distributed under the terms and conditions of the Creative Commons Attribution (CC BY) license (https://creativecommons.org/licenses/by/4.0/).
Share and Cite
MDPI and ACS Style
da Fonseca, A.V.; Cordeiro, D.; Molina-Gómez, F. Recommended Procedures to Assess Critical State Locus from Triaxial Tests in Cohesionless Remoulded Samples. Geotechnics 2021, 1, 95-127. https://doi.org/10.3390/geotechnics1010006
AMA Style
da Fonseca AV, Cordeiro D, Molina-Gómez F. Recommended Procedures to Assess Critical State Locus from Triaxial Tests in Cohesionless Remoulded Samples. Geotechnics. 2021; 1(1):95-127. https://doi.org/10.3390/geotechnics1010006
Chicago/Turabian Styleda Fonseca, António Viana, Diana Cordeiro, and Fausto Molina-Gómez. 2021. "Recommended Procedures to Assess Critical State Locus from Triaxial Tests in Cohesionless Remoulded Samples" Geotechnics 1, no. 1: 95-127. https://doi.org/10.3390/geotechnics1010006