1. Introduction
Cultural heritage sites are often safely preserved as valuable artifacts of human culture and examples of actual historic facts in order to ensure they will be available to future generations. Interest in the repair and restoration of damaged cultural heritage sites is growing in Korea, and the need for research on materials appropriate for the restoration of such cultural heritage sites is increasing. Pagodas, which have been designated important cultural heritage artifacts in Korea, are often damaged or destroyed by factors such as defective structural bonds, earthquakes, and typhoons. Weathering that occurs over time is also a problem. Because architectural sites are always exposed to the outdoor environment, they are at high risk of damage from natural disasters and accidents and need to be better protected.
Assessing the seismic vulnerability of historical masonry is an important topic around the world due to the frequent occurrence of earthquakes. Because masonry constructions typically consist of complex structural systems, detailed knowledge and information are required to understand their behavior [
1,
2]. In particular, investigating the seismic response of many historical masonry structures is of paramount importance because of their limited ability to resist earthquakes. Appropriate numerical modeling of historical masonry is a basic preliminary step before necessary effective repair and reinforcement can be undertaken [
3,
4,
5,
6,
7,
8].
The structural safety of a stone pagoda can be largely divided into static safety and dynamic safety. Static safety is affected by the vertical load of the stone, the strength and structural behavior of the stone, and the condition of the stone contact surface [
9,
10,
11,
12]. Dynamic safety means safety against the effects of earthquakes, wind, and other dynamic loads. If the structure becomes loose or defects such as cracks or voids form, stiffness is decreased, resulting in reduced dynamics, especially at natural frequencies. This makes it possible to indirectly estimate the robustness of the structure by grasping the dynamic characteristics.
South Korea’s masonry stone pagodas have unique structures, and many studies have assessed them. Kim and Ryu [
13] produced a full-scale model of the five-story stone pagoda of Sang-Gye-Sa. The top of the pagoda was destroyed in an earthquake in 1936, and the ground motion intensity was quantitatively estimated. In the experiment, exploratory testing and fragility testing were performed on a shaking table. Through these tests, important relationships between failure modes and ground motion properties were obtained. Park and Kim [
14] conducted a centrifuge test of scaled-down masonry structures. The test results showed that when the small-scale models were translated to a full-size prototype scale, similar behaviors emerged. This demonstrates that scaled-down models can provide an almost accurate estimate of the seismic behavior of stone masonry constructions. To preserve and protect valued cultural heritage structures, these studies involved indirect seismic investigations using seismic centrifuge testing.
Park et al. [
15] carried out an evaluation of the seismic performance of two Korean representative masonry pagodas and architectural heritage sites using centrifuge tests. The peak acceleration specified in the Korean seismic design guidance did not cause the two pagodas to collapse. Park and Kim [
16] investigated the seismic behavior according of the structure of Cheomseongdae, comparing the original construction with a construction including long horizontal tie stones and a grid of interlocking headstones. The results of the experiment confirmed that the long horizontal connecting stones and tombstones increased seismic performance. These research results show the reasonable seismic response of cultural heritage structures.
Since the safety of a stone pagoda cannot be directly dismantled and separated, its stability is identified through indirect dynamic experiments and computer simulations. Lee et al. [
17] measured the natural frequency of a stone tower and calculated the stiffness of the joints using an eigenvalue analysis, assuming a multiple-degree-of-freedom model. The lateral displacement of the structure with respect to the lateral force was estimated using the computer modeling considered here. More detail was provided on the collapse mechanism that took place in a five-tier pagoda [
18]. The performances of these historic pagodas’ were examined in accordance with the dynamic characteristic parameters after dynamic tests were conducted to ascertain their dynamic features. The Songjiang Pagoda’s dynamic properties were examined, and the damage sites and intensity of the pagoda were assessed using the difference in modal information before and after damage [
19,
20,
21].
Hong and Kim [
22] analyzed a masonry stone pagoda using the discrete element method, which enables modeling of the discontinuous surface between stones. In the discrete element method model, the rock joints between stones considerably affect the analysis result and must be judged accurately. However, because the rocks in a pagoda are made of different materials, they are difficult to accurately identify. Pham et al. [
23] assessed the seismic performance of the Seokgatap stone heritage pagoda using three-dimensional finite element modeling; the model then was confirmed by dynamic centrifuge testing. The results confirmed that the analytical modeling and dynamic centrifuge tests had similar behavioral characteristics, producing results that were in agreement. Kim et al. [
24] used finite and discrete element software for modeling and analyzed the seismic behaviors of a three-story stone pagoda at the Cheollyongsa temple site, which was damaged by the Gyeongju earthquake of 2016. When the actual damage was compared to the risk analysis, the stone pagoda was determined to be earthquake-resistant at the life safety level. To describe how multitier pagodas behave dynamically, Jaishi et al. used linear response spectrum studies.
The purpose of the present research was to predict seismic performance by conducting dynamic tests and by analyzing the dynamic characteristics of masonry stone pagodas using simulation analysis. Based on measured geometric criteria, a finite element model of a masonry stone pagoda was created. By using simulation analysis software ANSYS 19.2, the same size stone pagoda model was evaluated with respect to its seismic response and other important parameters. In order to confirm the accuracy of the finite element model, the measured natural frequency of the masonry stone pagoda was compared with the modal analysis of the finite element model. The acceleration vs. time response, peak acceleration on different stone stories, failure mode shape at each level load, frequency, and amplification ratio were obtained, analyzed, and verified with the centrifuge dynamic experimental results. The results of the finite element model and the experimental data have an acceptable correlation, anticipating the structural performance of similar masonry stone pagodas.
2. The Five-Story Stone Pagoda at Jeongnimsa Temple Site
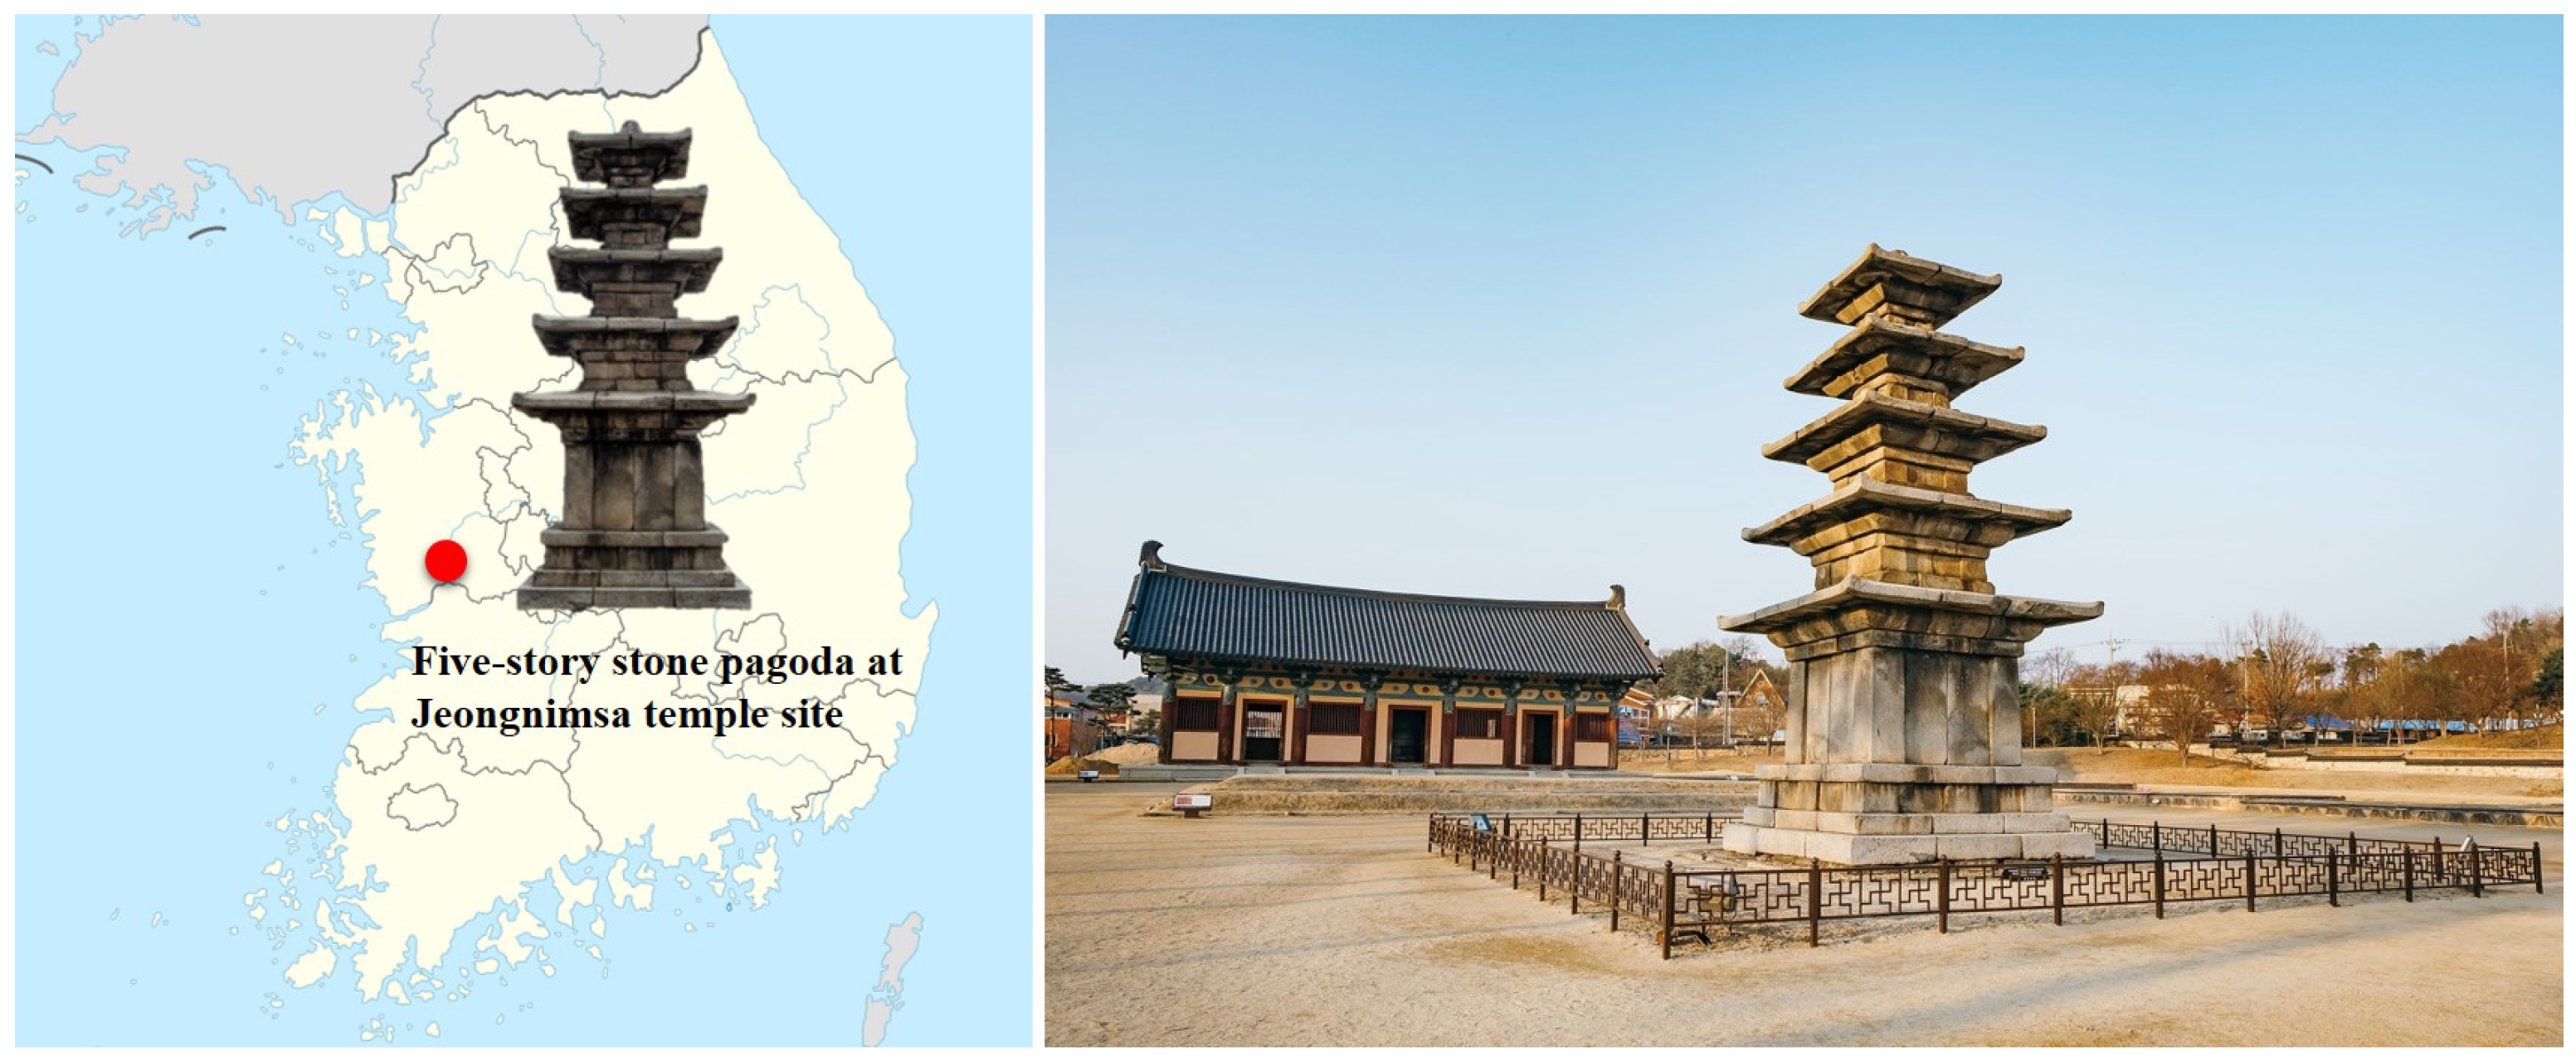
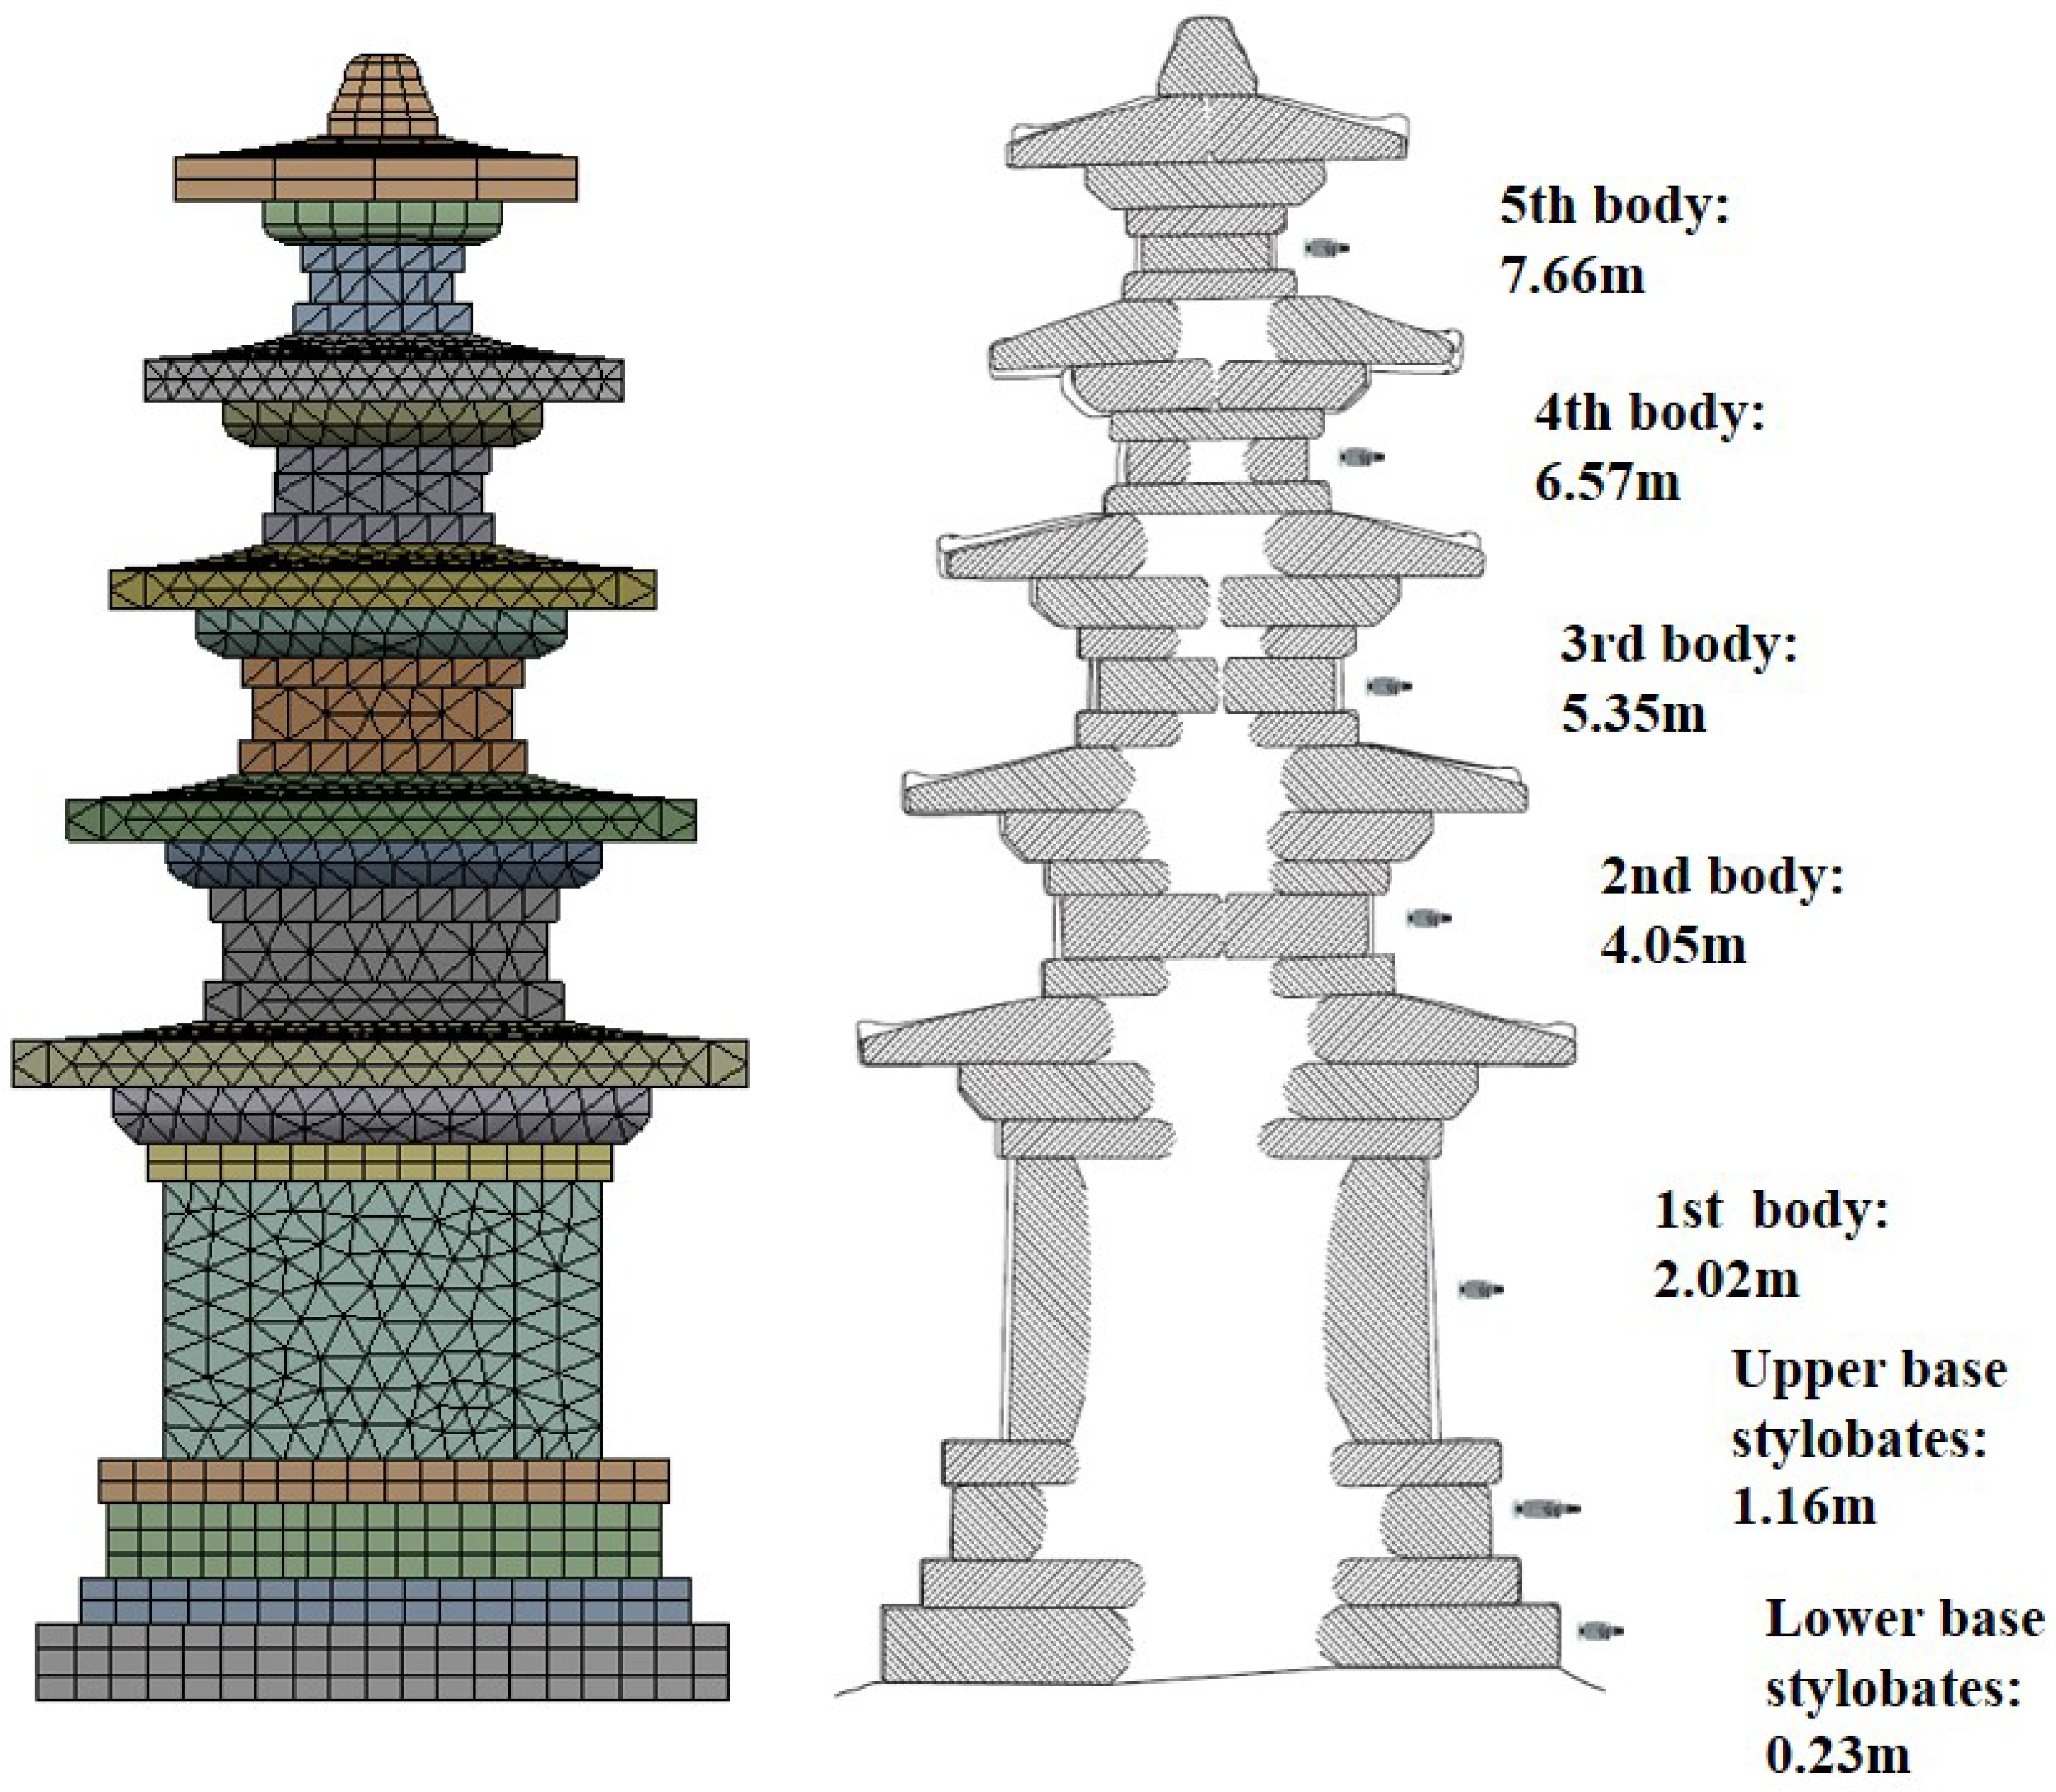
The five-story stone pagoda at Jeongnimsa temple site is a representative stone pagoda of the Baekje dynasty. It was designated National treasure No. 9 on 20 December 1963. This stone pagoda can be said to be the progenitor of the Korean stone pagoda and, along with the pagoda at Mireuksa temple site in Iksan (National treasure No. 11), is the only remaining stone pagoda from the Baekje dynasty [
25].
Figure 1 depicts the location and shape of the five-story stone pagoda at the Jeongnimsa temple site.
Table 1 shows the characteristics of the five-story stone pagoda at the Jeongnimsa temple site.
While the pagoda at the Mireuksa temple site combines wooden architecture with stone, the five-story stone pagoda at the Jeongnimsa temple site raises the beauty of its shape to the next level, offering an example of an elegant yet restrained stone pagoda. The base of the five-story stone pagoda at the Jeongnimsa temple site in Buyeo had pillar stones placed in the center and at the corners of each side, and pillars were erected at each corner of the body stone of each floor of the pagoda. The narrow and shallow first stage, the expression of pillars in the Baelim technique, and the shape of the thin and wide roof stone faithfully follow the form of a wooden building but show a sophisticated and creative form rather than a simple imitation, and the overall shape is very solemn and refined.
3. Field Investigation and Measured Natural Frequency
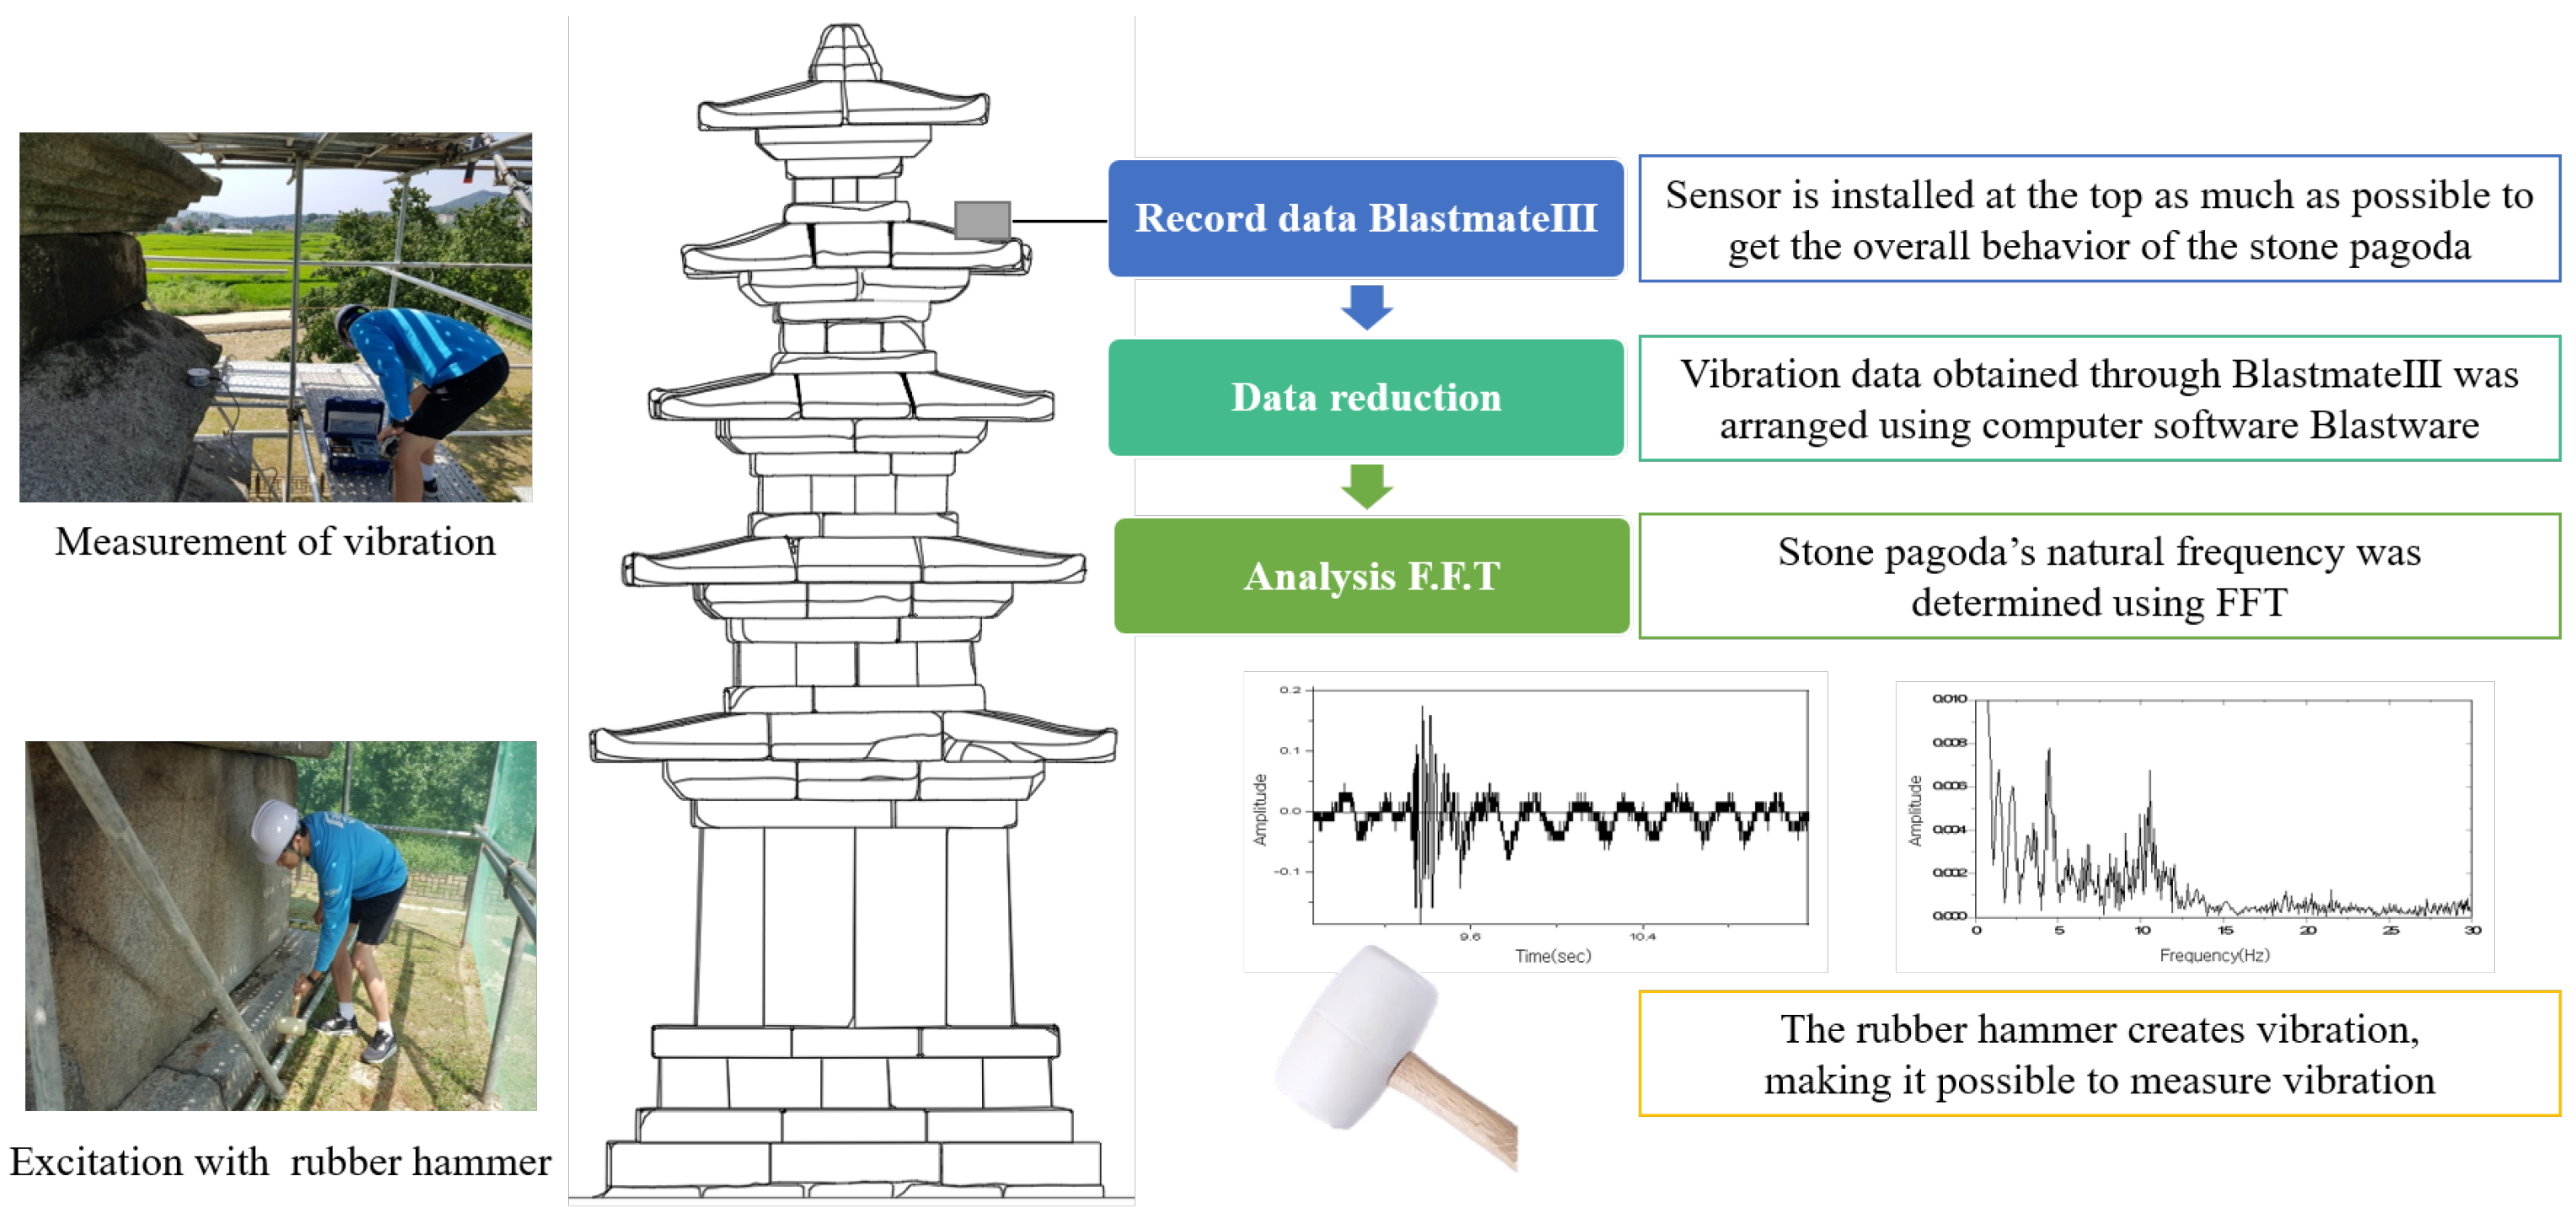
Vibration experiments were conducted to determine the stone masonry pagoda’s mechanical and physical properties. The following is a description of the main test variables. The device used was a typical Blastmate Series IIII device, which has a standard transducer and four recording channels. Many national frequency analysis standards and different sample rates have been established using Blastmate III to evaluate dynamic features (such as natural frequencies, mode shapes, and damping ratios). The instrument’s parameters are described in
Table 2.
The purpose of this study is to understand the behavior of the entire stone pagoda, so the sensor was installed as high on the structure as possible. Very low levels of vibration caused by natural forces are observed in this area. Seismic excitation was induced with a 1 kg rubber hammer. Since the natural frequencies in the south–north direction and the east–west direction appear differently, it was assumed that the first frequency in the low direction was the first mode of natural frequency. This study only considered the first mode.
Figure 2 presents the natural frequency measurement using the vibration apparatus and rubber hammer.
Data were measured using wireless data receivers with a program called Anylogger Wing, and data collected using BlastMate III were analyzed using Blastware V 8.01 F.F.T (fast Fourier transform). In this test, the attenuation ratio used a common logarithmic attenuation method, using a free-vibration curve that excludes as many elements as possible from time history data. Since most structures have an attenuation ratio of less than 0.1 percent, a simple formula (Equation (
1)) was used. This pagoda’s natural frequency was 4.5 Hz, and the damping ratio was 1.2%, as shown in
Figure 3 [
26].
where
is the damping factor, x
is the
i-th order amplitude in the free vibration response waveform, and x
is
i + 1 order amplitude in the free vibration response waveform.
Theoretically, under the same conditions, the higher the height of a masonry stone pagoda, the lower the natural frequency [
27]. The five-story stone pagoda at Jeongnimsa temple site has a slightly lower natural frequency compared to the five-story stone pagoda at Muryangsa temple (13.0 Hz), the three-story stone pagoda at Seollimwon temple site (5.3 Hz), the three-story stone pagoda at Heungbeopsa temple site (8.3 Hz), the seven-story stone pagoda in Tappyeong-ri, Chungju (5.5 Hz), and the five-story stone pagoda at Bongeopsa temple site (3.6 Hz).
Table 3 shows the dynamic test results of the stone pagodas.
This is thought to be the case because the five-story stone pagoda at Jeongnimsa temple site has no history of dismantling and restoration, unlike other stone pagodas. The restored Muryangsa five-story stone pagoda was measured at 13 Hz, and it was confirmed that the structural system became stronger after disassembling and restoration, partially because the joints were reinforced with cement mortar.
Masonry stone pagodas have large irregularities in each stone, and only the part that actually protrudes from the plane is in contact. The projecting part of the stone is called an asperity, and the sum of contact sections is called the real area of contact. The friction characteristic of this area have a considerable influence on the dynamic characteristics. The stone pagoda can be assumed to be a multinodal system model, and in the case of the five-story stone pagoda at Jeongnimsa temple site, it is a multiple-degrees-of-freedom structure, with 29 points.
Figure 4 illustrates the multiple-degrees-of-freedom shear vibration model. The equation of motion is the same as Equation (
2). The determined mass matrix and stiffness matrix follow Equation (
3) and Equation (
4), respectively.
Considering the free vibration of a single-degree-of-freedom structure, the solution of the above equation is shown in Equation (
6).
where
is the amplitude of the
ith coordinate.
Substituting Equation (
6) into Equation (
2) yields Equation (
7). representing a system of n quadratic equations with n unknowns and parameters, determining the eigenvalue of the matrix.
Depending on the magnitude of the stress, the stiffness of the stone contact parts differs, and the stress at the bottom of the stone pagoda is the greatest [
28,
29,
30]. In this study, the stiffness of the contact surface was measured, and the stress of the stone contact part of each stone was assumed to be the same, with only shear vibration considered as the vibration component. The result obtained for the average stiffness of the stone contact surface was the same as that obtain using Equation (
8). Here, stiffness means the value of the static friction state. When sliding occurs, the coefficient of friction changes according to the speed and distance.
4. Dynamic Centrifuge Test
The dynamic centrifuge model experiment conducted in this study used the centrifuge model test equipment of KAIST under the Korea Construction Engineering Development (KOCED) [
5]. This equipment is capable of centrifuge acceleration up to 240 g-tons, with a platform radius of 5 m. To recreate the prototype size stress field in a model structure, the essential concept behind the physical modeling of geotechnical systems using a centrifuge is to accelerate a reduced scale geotechnical structure to the requisite g level. When the model is created on a scale that is reduced to 1:N, it accelerates at N times Earth gravity.
Table 4 shows the scaling laws for the dynamic centrifuge test.
The centrifuge was set up in a geotechnical system to provide the stress field for the considered specimen. At the requisite g level, the reduced scale of acceleration was created and, applying the spread loading to the stone pagoda model. Park, Kim, and Choo [
15] conducted a dynamic centrifuge test and analyzed the effect of seismic load on Jeongnimsa Temple with five stone levels using a 1/15 scale ratio prototype. The authors performed the details of the dynamic centrifuge test in accordance with the scaling law, as shown in
Table 4, and geotechnical centrifuge technology [
31,
32]. A scaling factor of 1/15 was used to construct the stone pagoda specimen with the specifications described in
Table 5. The design and experimental process were prepared to adopt the testing condition and dynamic container condition and respond to technique problems.
In terms of material properties, Hwang-deung stone was used to construct the stone pagoda specimen [
33]. Hwang-deung stone is a kind of homogeneous, crack-resistant granite. The elastic modulus was estimated based on the shear wave velocity value in Equation (
2).
Table 6 shows the material properties of the Iksan Hwang-deung stone used to make the mock-up.
where
E is the elastic modulus,
is the density,
V is the P velocity,
V is the S velocity, and
is Poisson’s ratio.
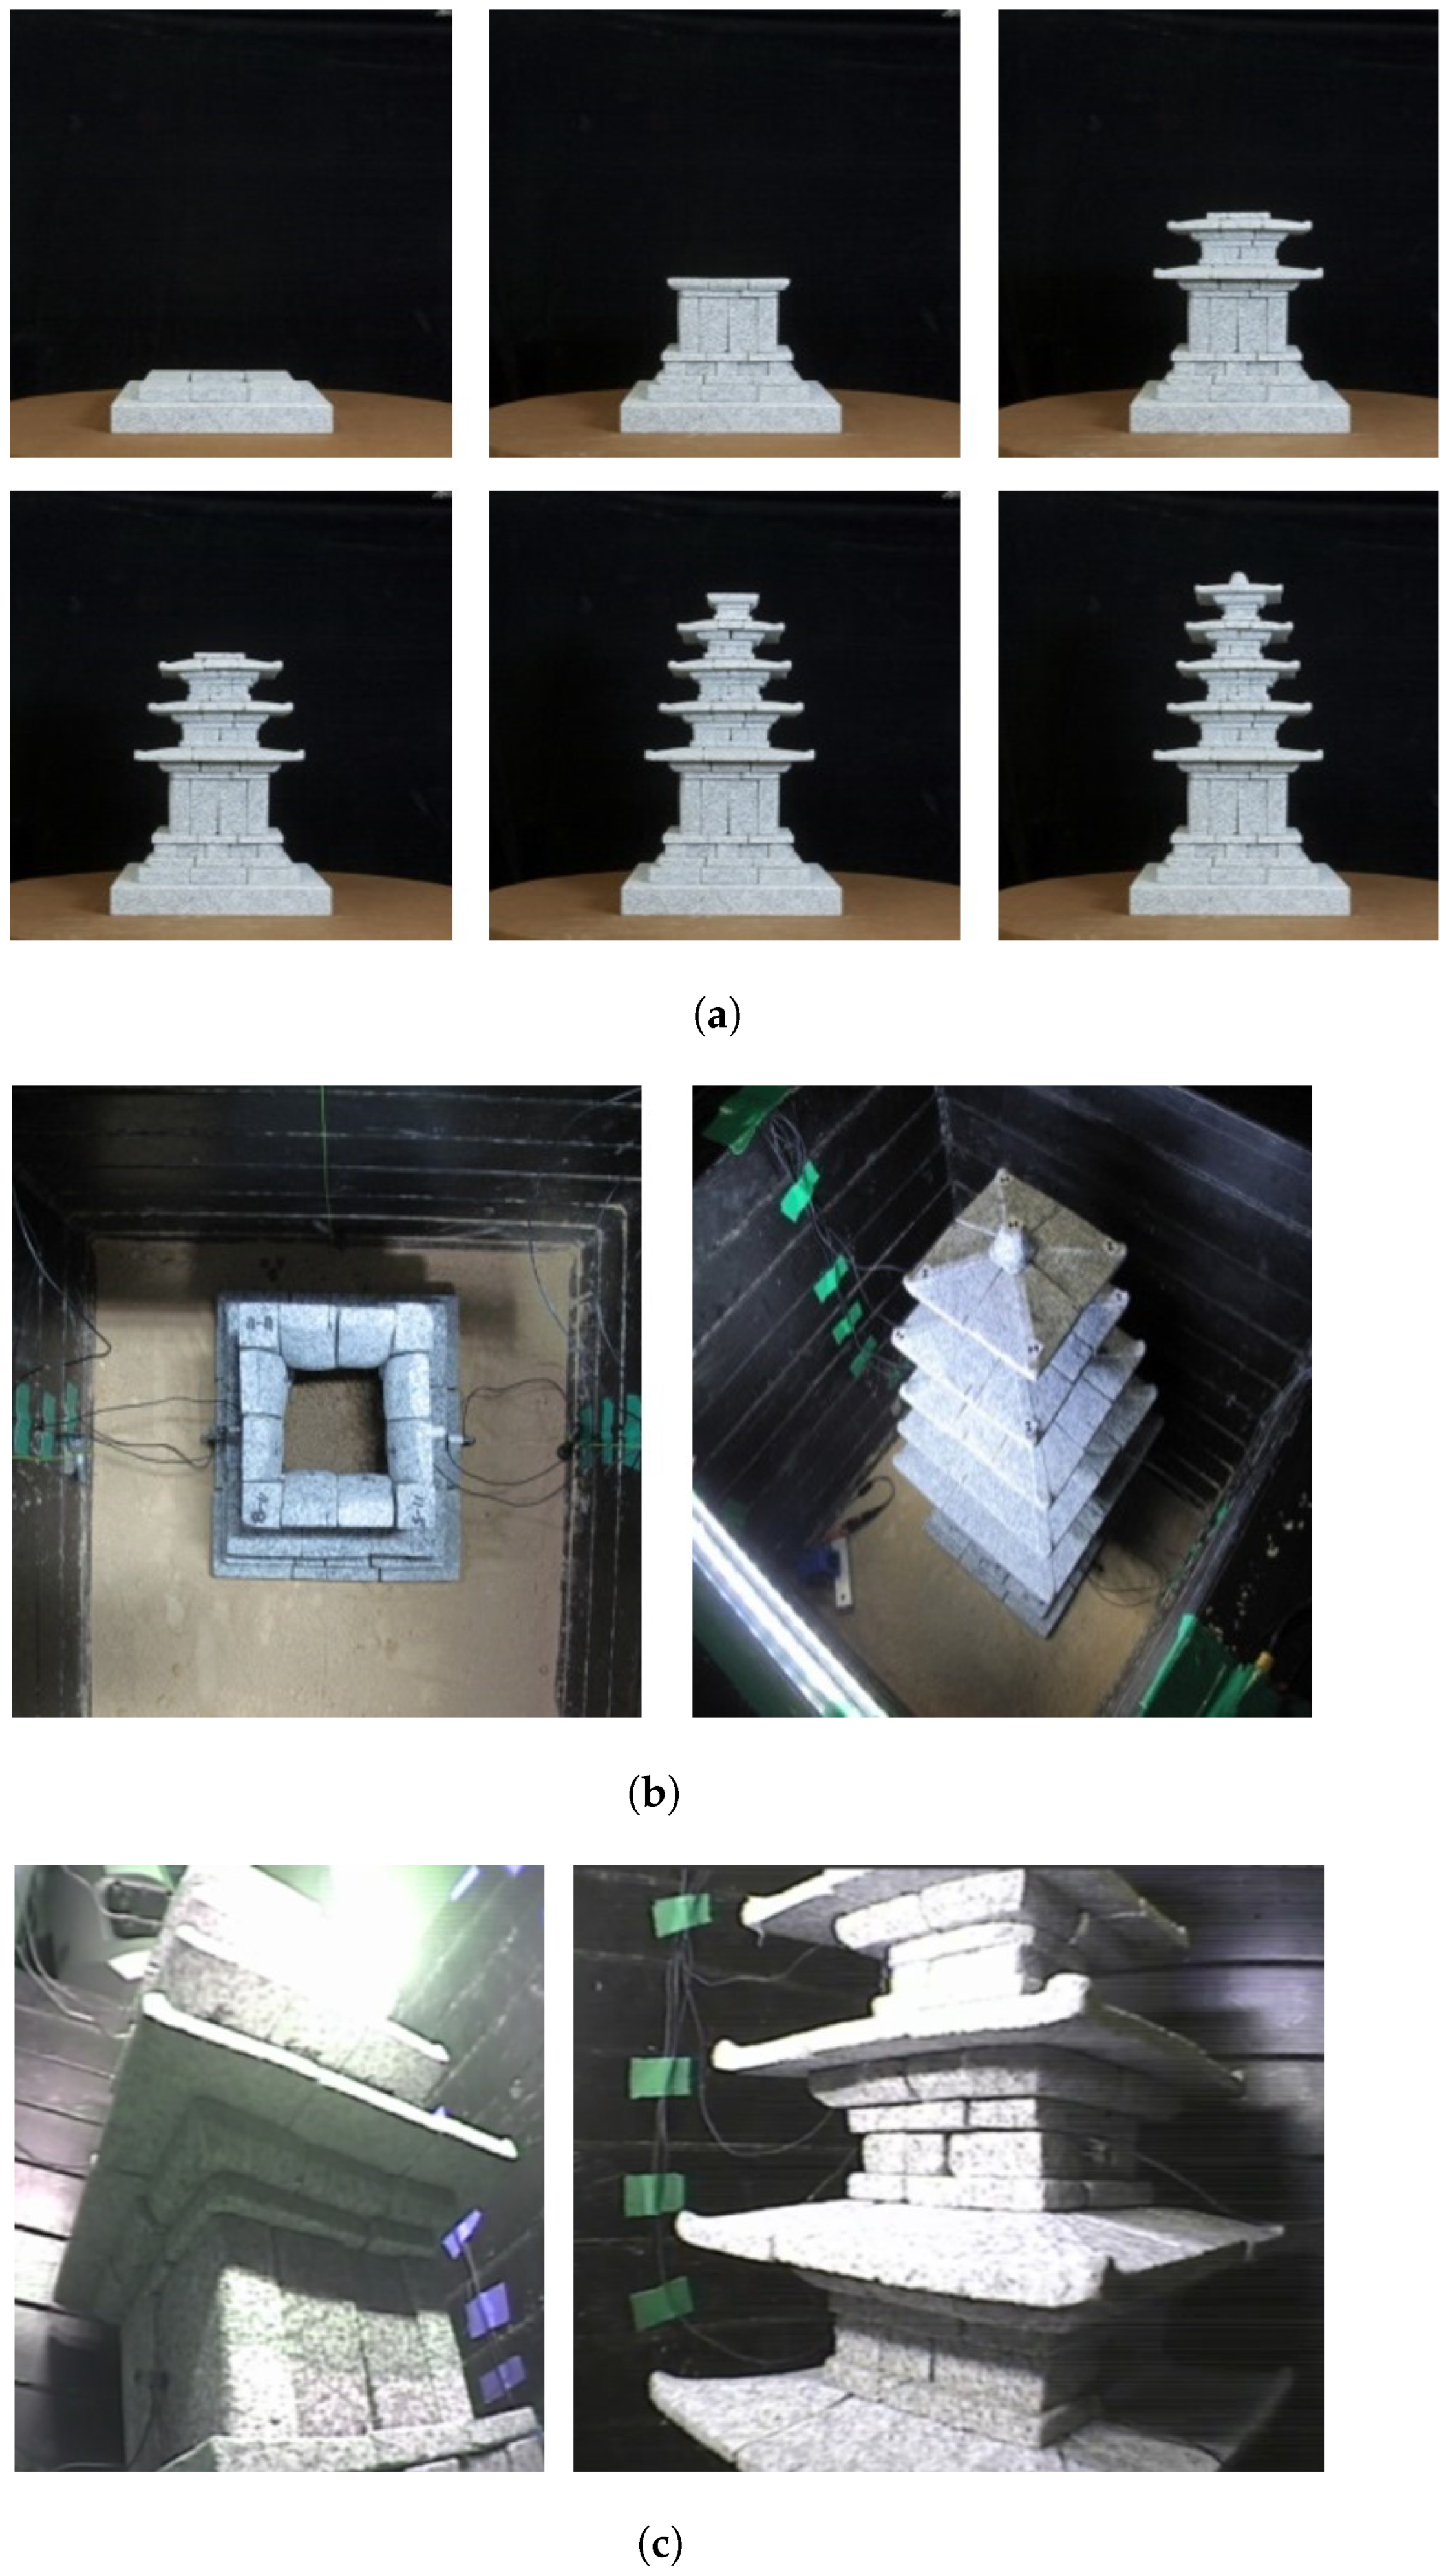
Figure 5 depicts the process of building the stone model and setting up the dynamic centrifuge test [
15]. The model was constructed level-by-level from the stone basement to the top sections, as shown in
Figure 5. The structure was fixed in the centrifuge container, where the seismic simulator and monitor were already set up by g level.
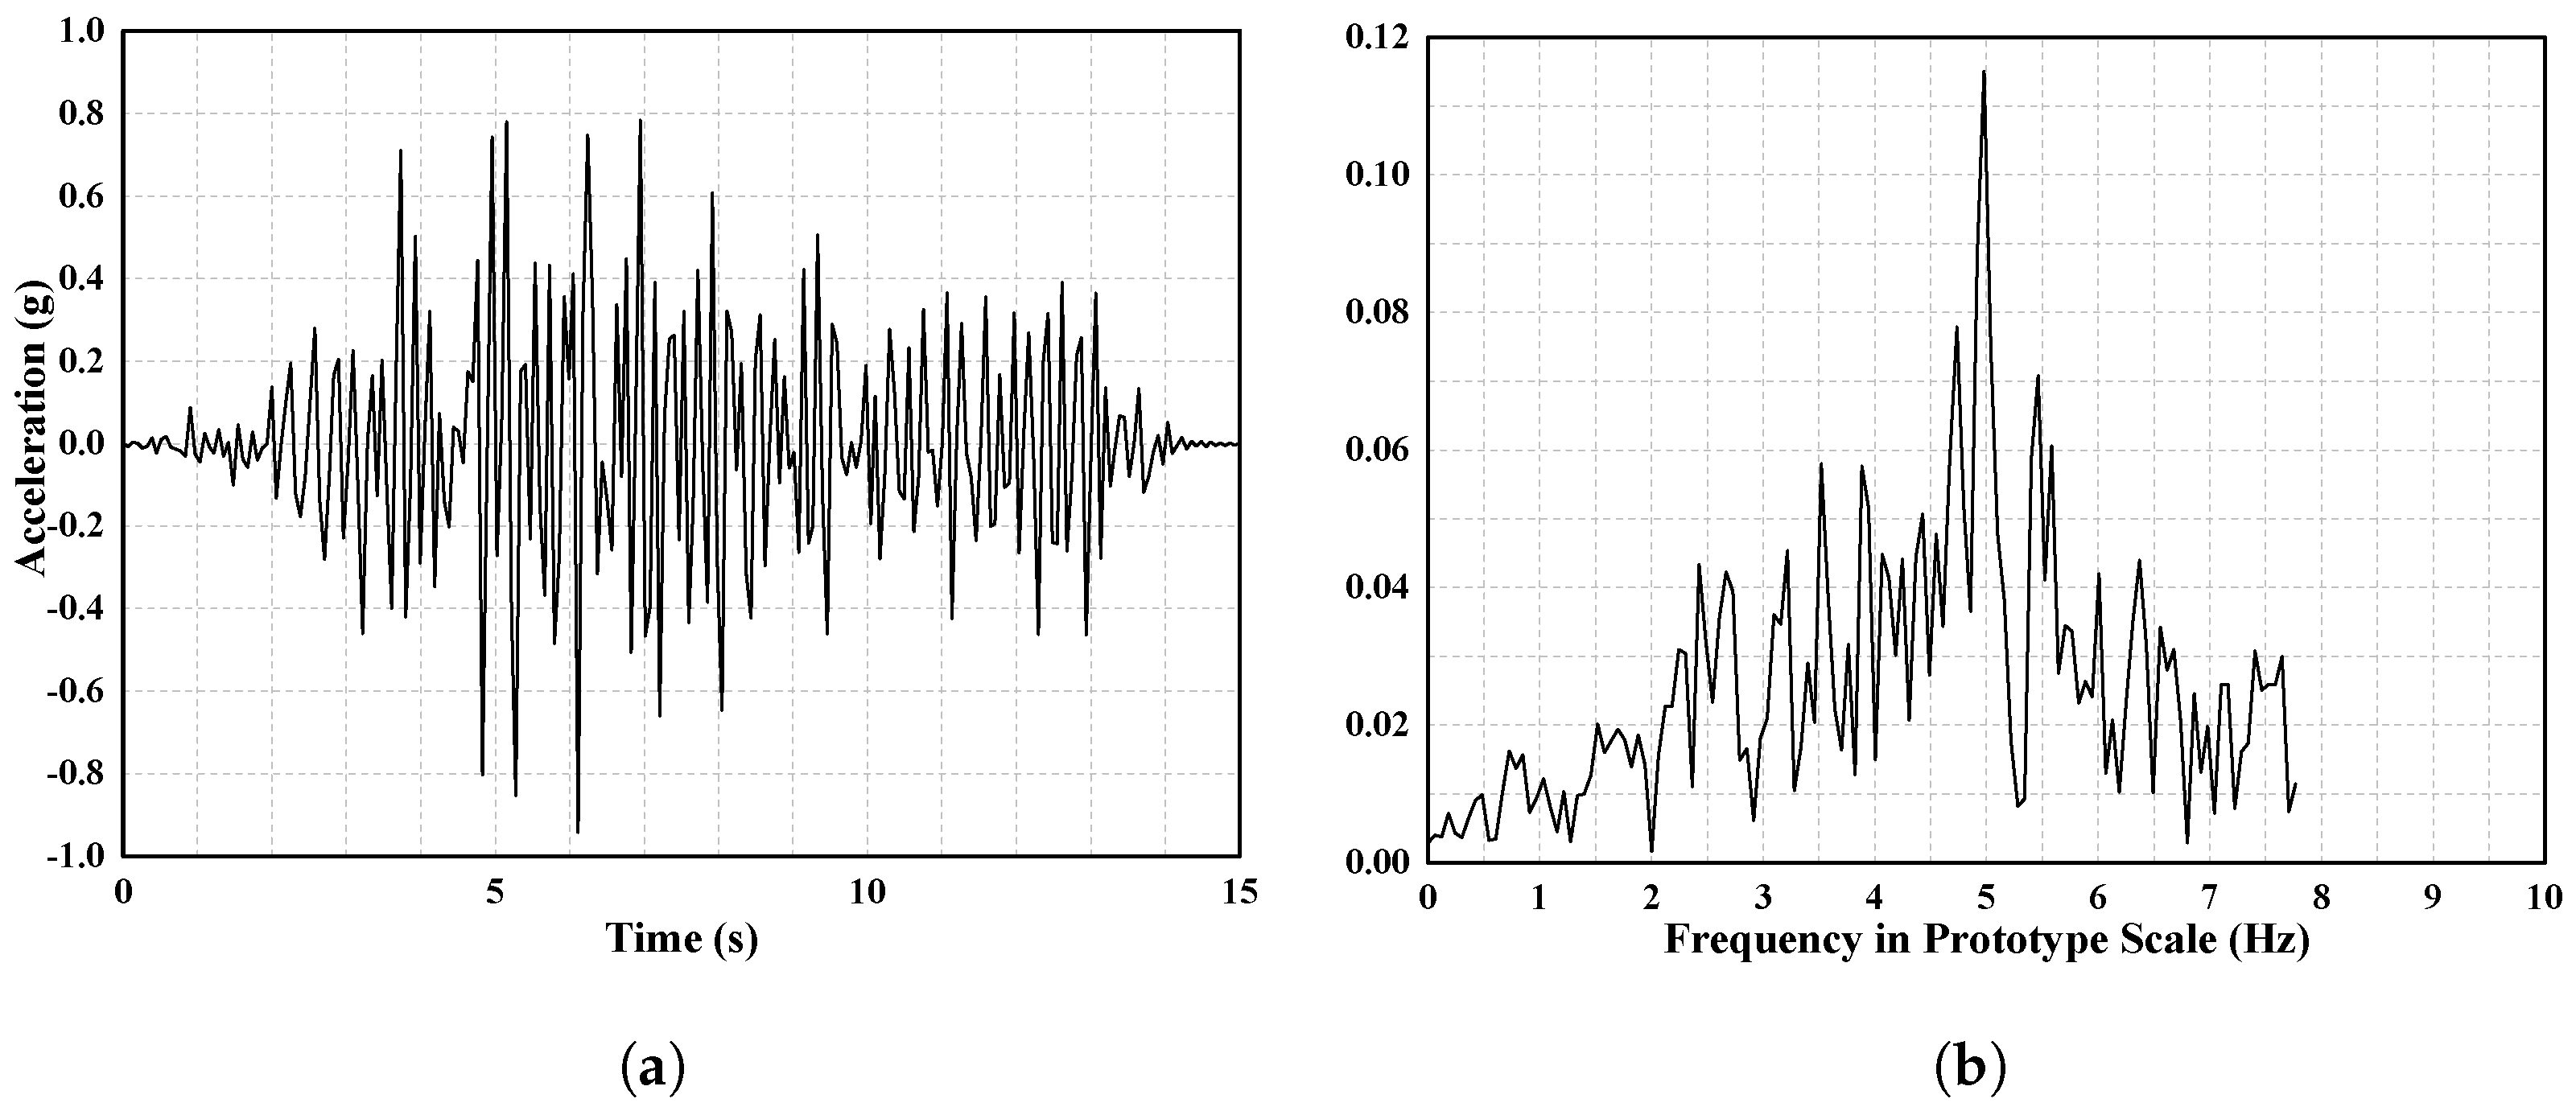
A 7.4 Richter earthquake was recorded in Ofunato, Miyaki-Ken Oki, Japan, on 12 June 1978. This earthquake record was applied to the centrifuge test of Jeongnimsa temple because it is single short period similar to the Korean geological specification. This type of earthquake has a short period of occurrence and is the type most likely to occur at the site under study due to geological characteristics in Korea. Therefore, this significant motion record was chosen to assess the seismic response of the five-story stone pagoda at the Jeongnimsa temple site, as shown in
Figure 6.
Various peak acceleration levels were input by the seismic waves imposed by the centrifuge test, with magnitudes of 0.069 g, 0.088 g, 0.111 g, 0.208 g, 0.275 g, 0.355 g, and 0.424 g, using the centrifuge dynamic equipment. PCB piezotronic accelerometers (PCB353B17) were attached to each stone pagoda story from 0.23 m to 7.66 m to measure the earthquake behavior, as shown in
Figure 7. Applying the scaling principles listed in
Table 4, the performance of the prototype model was calculated for the full-scale model using scaling factor technology.
5. Modeling of a Masonry Stone Pagoda Using Dynamic Analysis
The process used for the masonry pagoda simulation analysis is shown in
Figure 8. The four steps included a field survey, CAD drawings, ANSYS 3D modeling, and analytical results. The CAD drawing was created from a field survey [
34]. In this study, each of the masonry stones was created individually using 3D modeling program SpaceClaim. All of the data were imported, and the three-dimensional masonry pagoda model was simulated using commercial finite element Program ANSYS 19.2 [
35].
A three-degrees-of-freedom SOLID 185 element was defined for masonry pagoda modeling in ANSYS, and contact element CONTAC174 was used for connection between the stone layers. To assess the impact of connection properties on seismic behavior, the stiffness of the contact surface was calculated using the measured shear stiffness values. The incremental iterative of the Newton-–Raphson methodology was applied to nonlinear analysis to converge for the finite element solution.
5.1. Analysis of the Natural Frequency
The harmonic response in ANSYS was used to verify the structure’s natural frequency. In the analysis, an excitation of 1N was applied in the same way as the method for measuring the natural frequency of the actual stone pagoda, and the natural frequency at the top was confirmed in the same way as when a sensor was installed on the top. The study was carried out based on 0.005 s, as the natural frequency was measured, just as the data were confirmed based on 0.005 s.
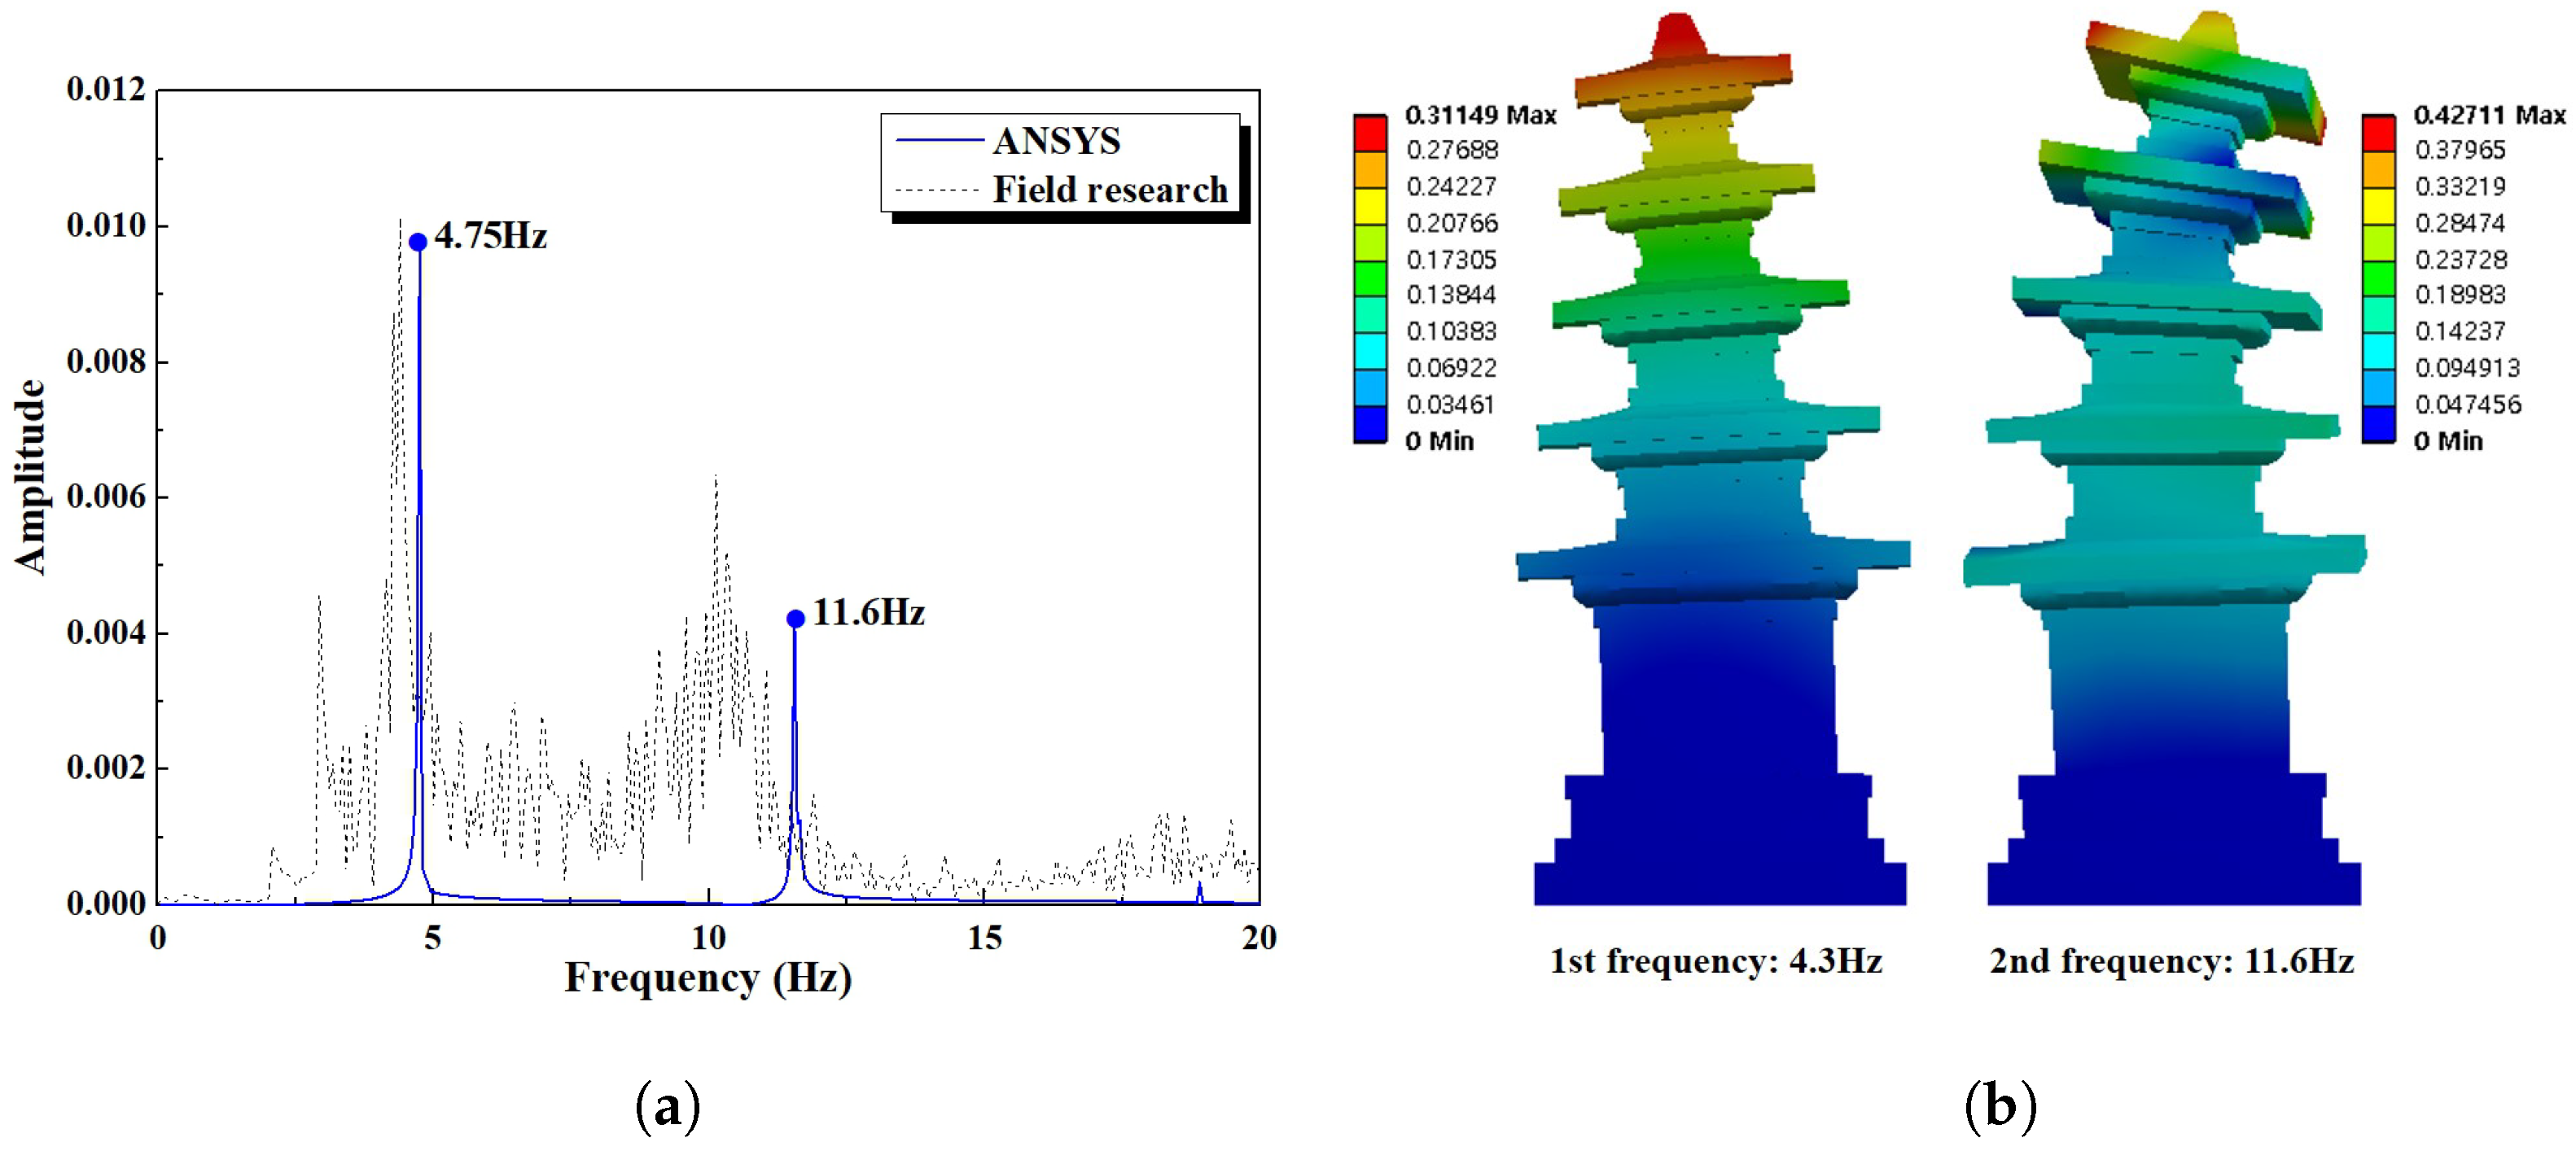
Figure 9 depicts the frequency domain and mode shapes of the ANSYS analysis results. The first and second mode can be seen in the results of the analysis. The first mode was measured at 4.75 Hz, and the second mode was measured at 11.6 Hz. The previous study measured the natural frequency at 4.5 Hz, but in the analysis, it was measured to be 4.75 Hz, which is a similar value. When checking the amplitude, the actual measured value was 0.00832 mm/s, whereas the value was 0.0114 mm/s in the analysis. That is, a larger amplitude value was found in the analysis than in reality. The difference in amplitude can be attributed to many variables because the force is not constant under actual excitation.
Figure 9b illustrates the mode shape. The deformation according to the mode shape occurred at 0.31 mm in the top in the first mode and 0.4 mm in the second mode.
5.2. Comparison of Peak Acceleration Results from Experiment and Simulation
The effects of the Ofunato earthquake were compared with the dynamic centrifuge test using ANSYS Workbench transient analysis. As yet, there is no general seismic design code for architectural cultural heritage sites in Korea. Because of its nature, once a cultural heritage collapses, it is impossible to restore it to its original state, which is why such structures are considered special. The seismic waves were calculated and applied with a recurrence period of 50 to more than 2400+ years. A range of peak acceleration levels of 0.069 g (50 year) to 0.424 g (2400 + year) was applied to the finite element model with the same dynamic centrifuge test conditions. The seismic behavior of the stone pagoda model under the influence of the Ofunato earthquake was determined by obtaining the peak acceleration at different pagoda heights of 0 m, 0.23 m, 1.16 m, 2.02 m, 4.05 m, 5.35 m, 6.57 m, and 7.66 m. The seismic behavior of the model is described and compared in
Table 6 to that of the centrifuge test. This comparison can be seen in
Figure 10,
Figure 11 and
Figure 12, where the experimental and simulation results for each loading condition and general comparison are described.
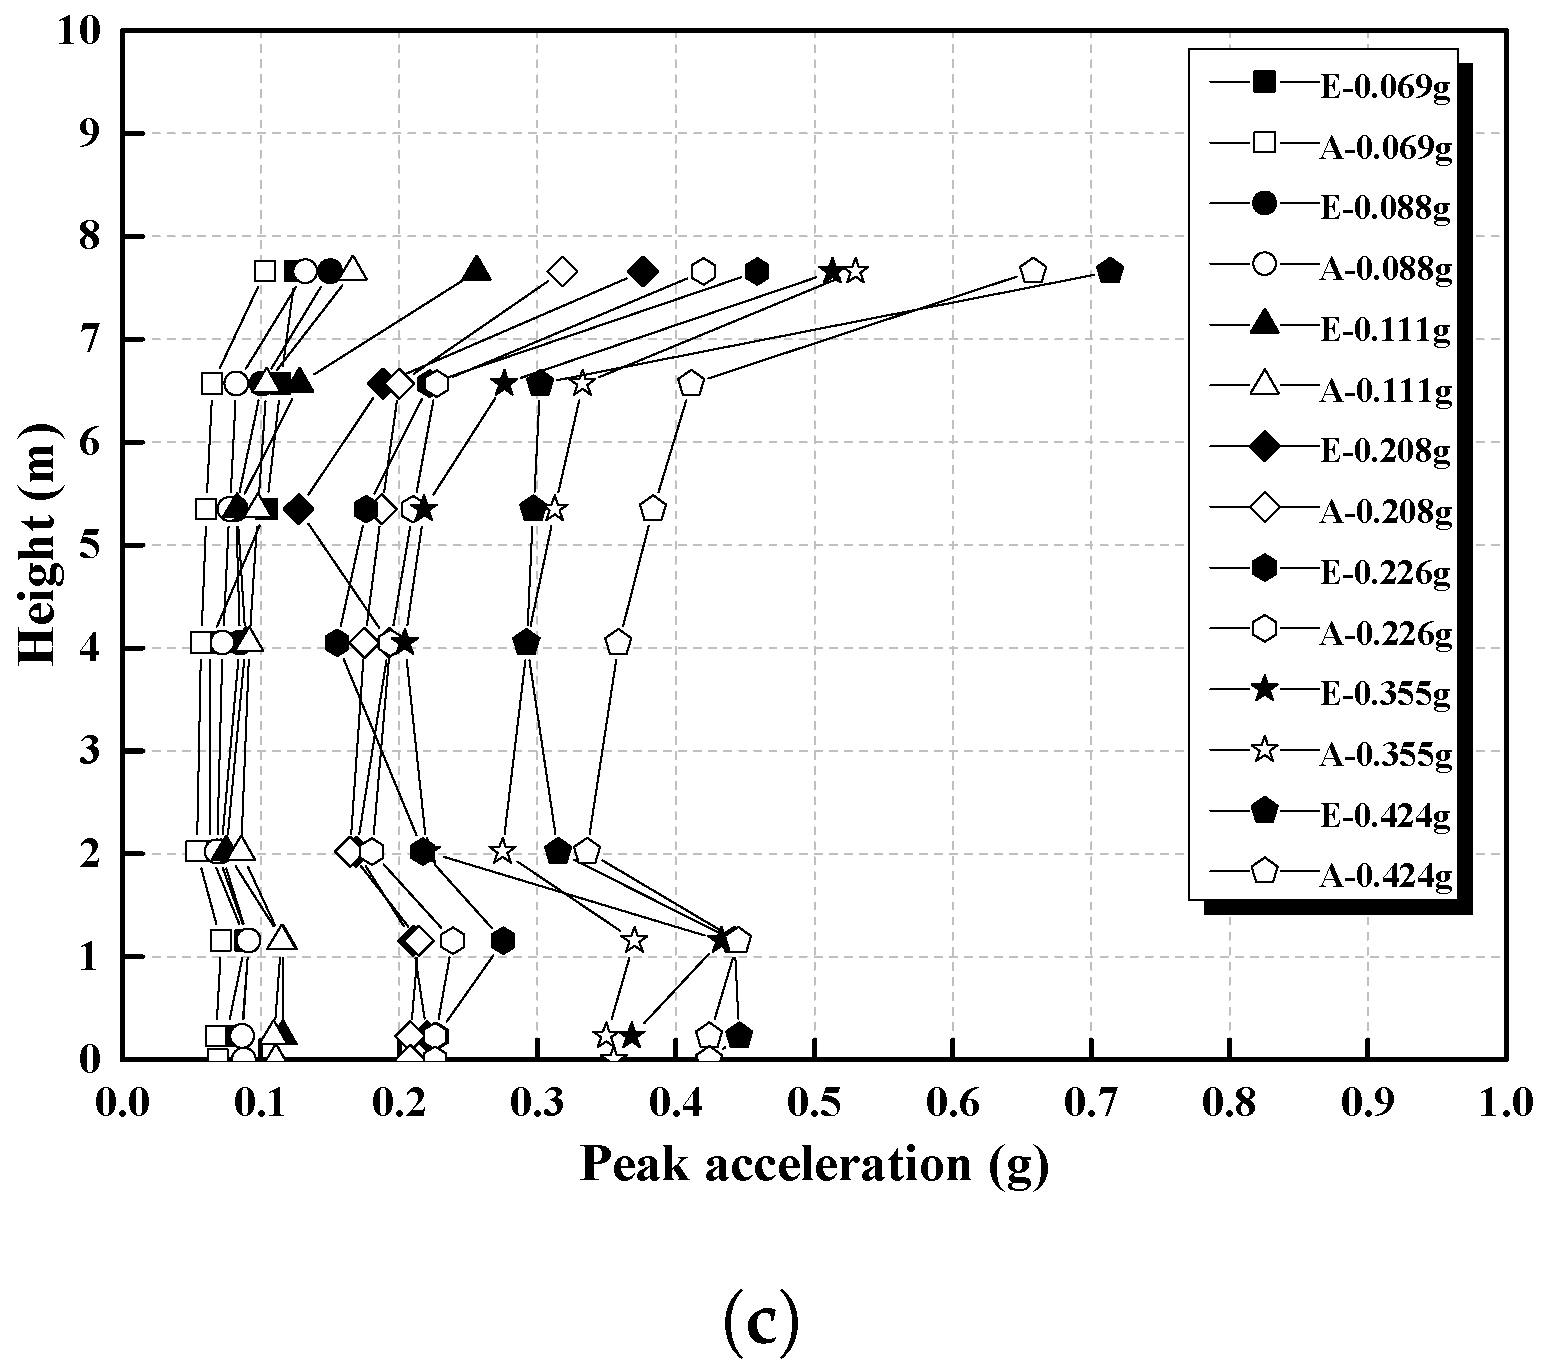
Table 7 and
Figure 10 shows the peak acceleration for each input ground motion from the experimental and simulation results. Peak accelerations from the centrifuge test were transferred to the behavior of the prototype construction using frequency, amplitude, and length scaling laws, while the simulation acceleration was derived using transient analysis. Two results with the same peak acceleration trend were examined, as shown in
Figure 10. Peak acceleration was also faster at the higher point of the stone pagoda than at the lower location. When the peak accelerations were small, such as 0.069 g, 0.088 g, or 0.111 g, a small acceleration occurred toward the top. When the peak accelerations were large, the degree of deformation of the acceleration was large. Stone masonry pagodas in Korea are structures made by stacking stones. The uppermost member is the most vulnerable to slipping, and sliding rarely occurs near the bottom. It was confirmed that this is because the self-weight and the vertical load of the upper part and the resistance to slipping, which is increased toward the lower part.
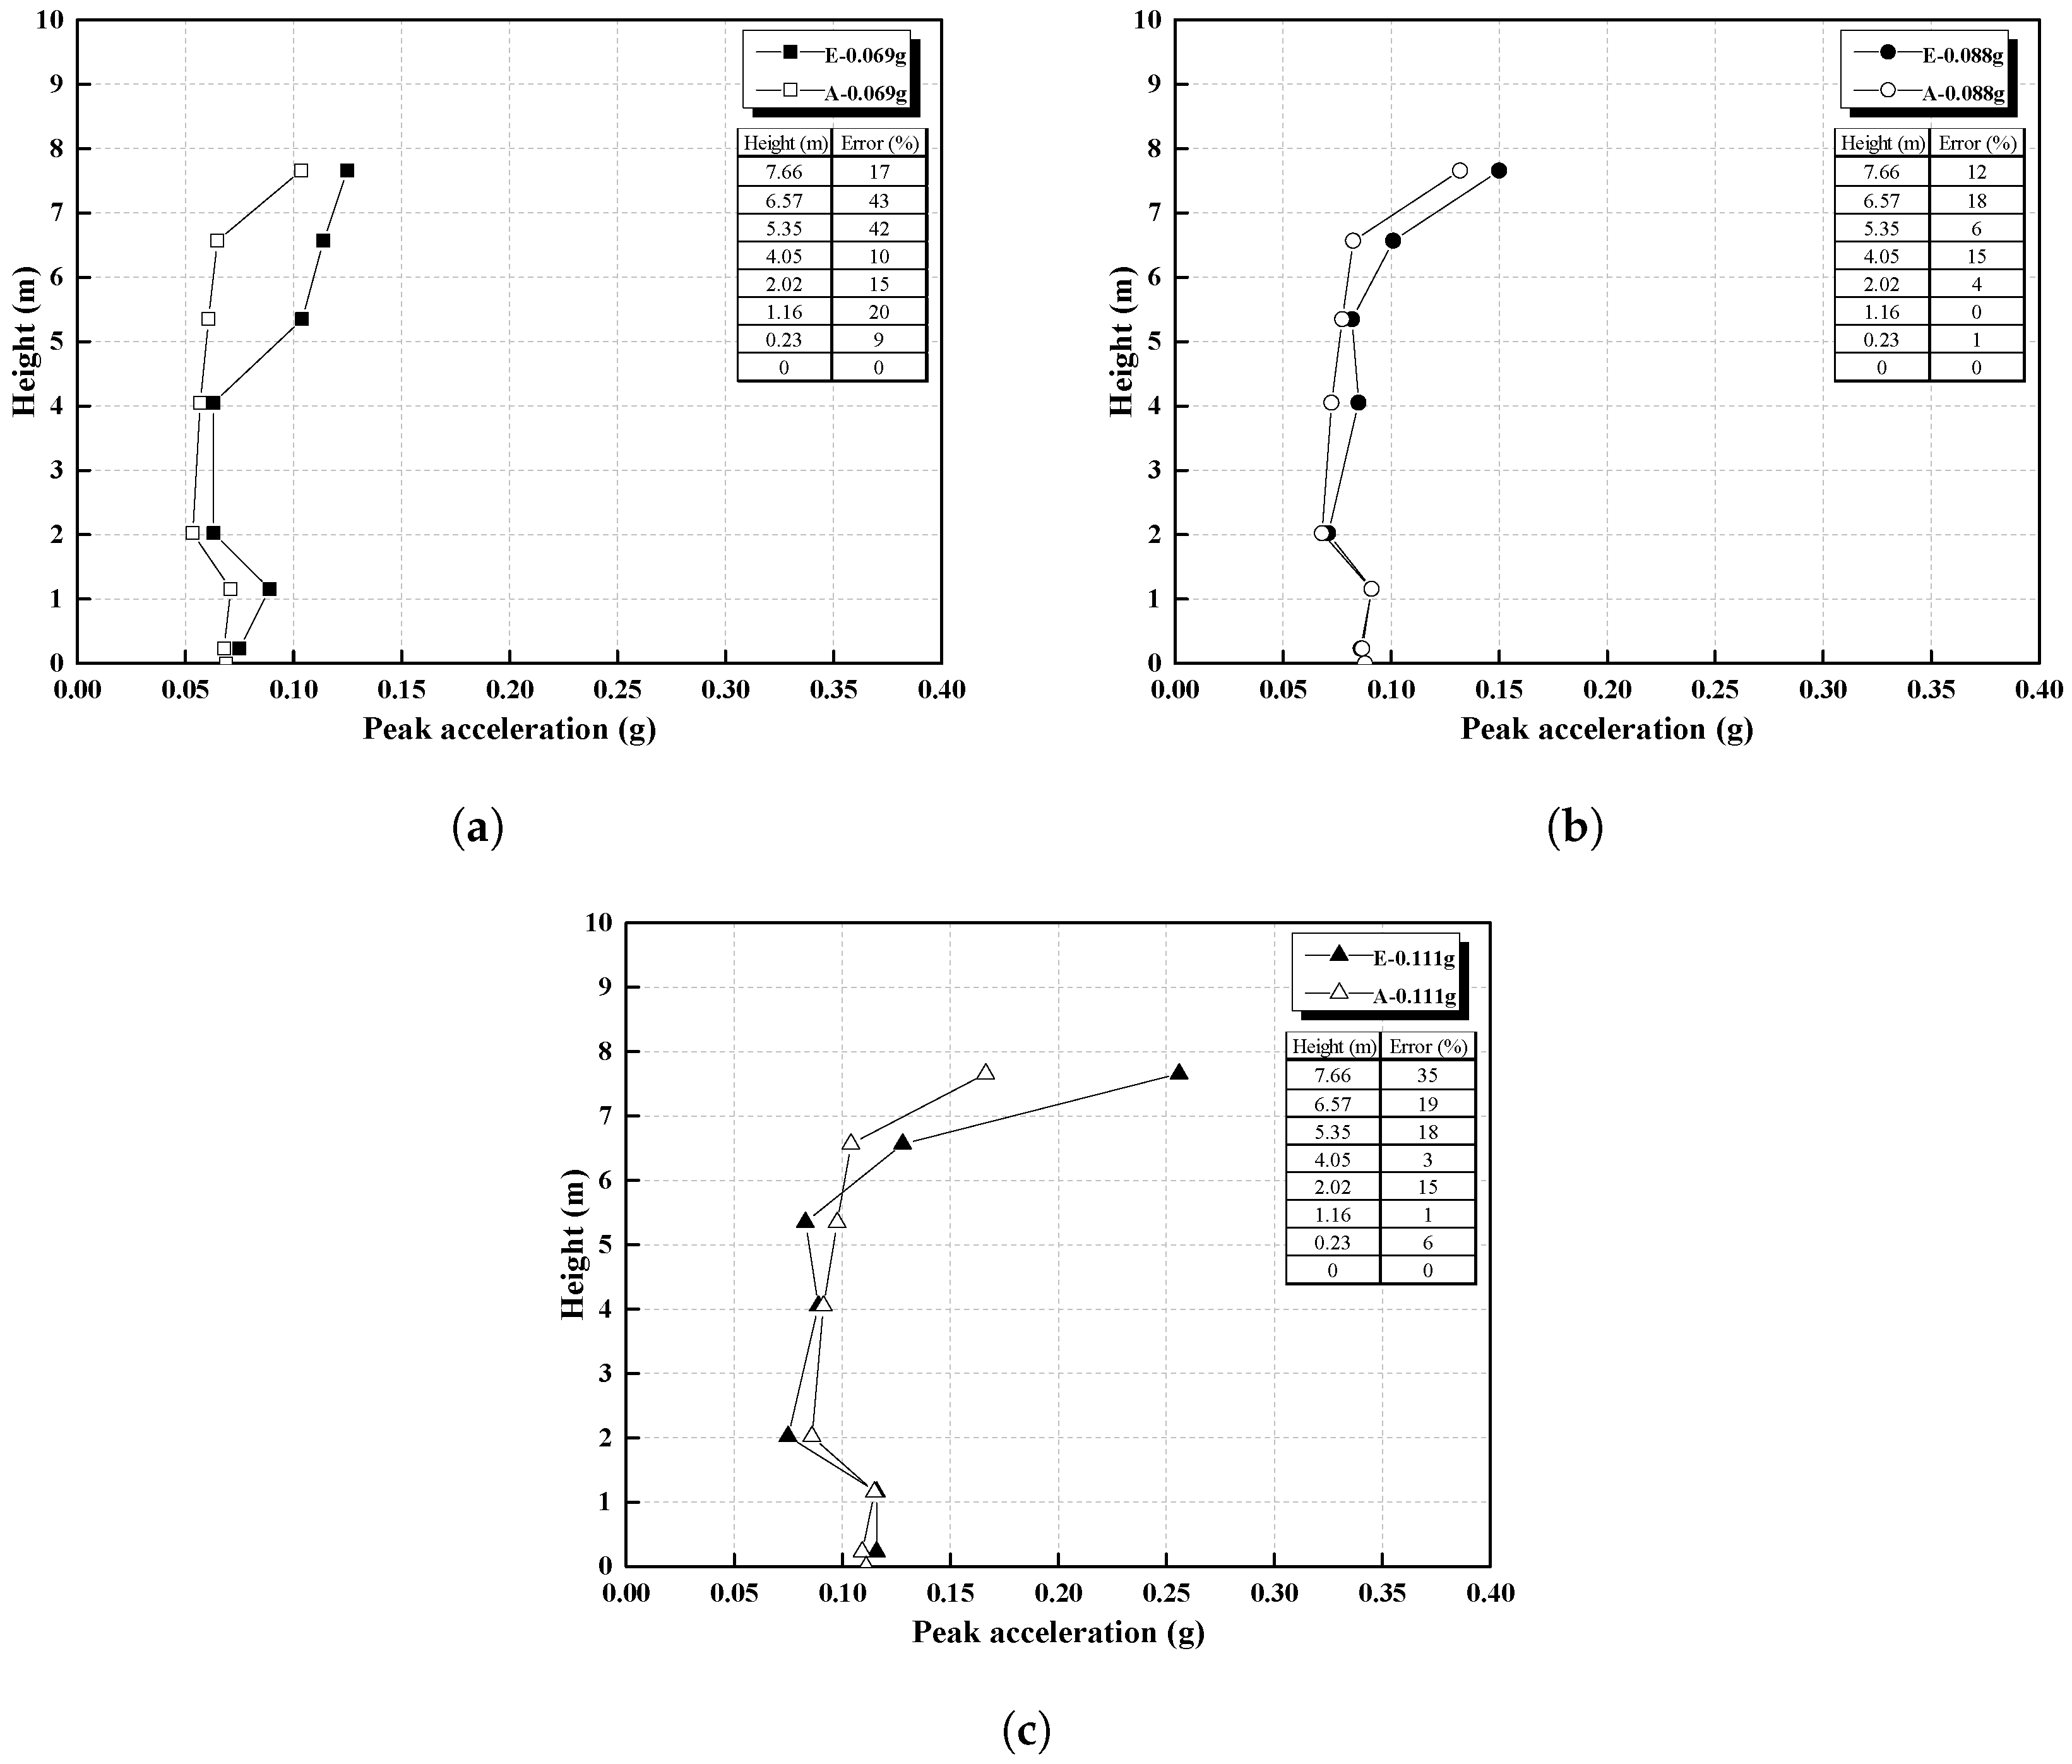
Figure 11 and
Figure 12 illustrate the peak accelerations from the experiment and simulation results in greater detail.
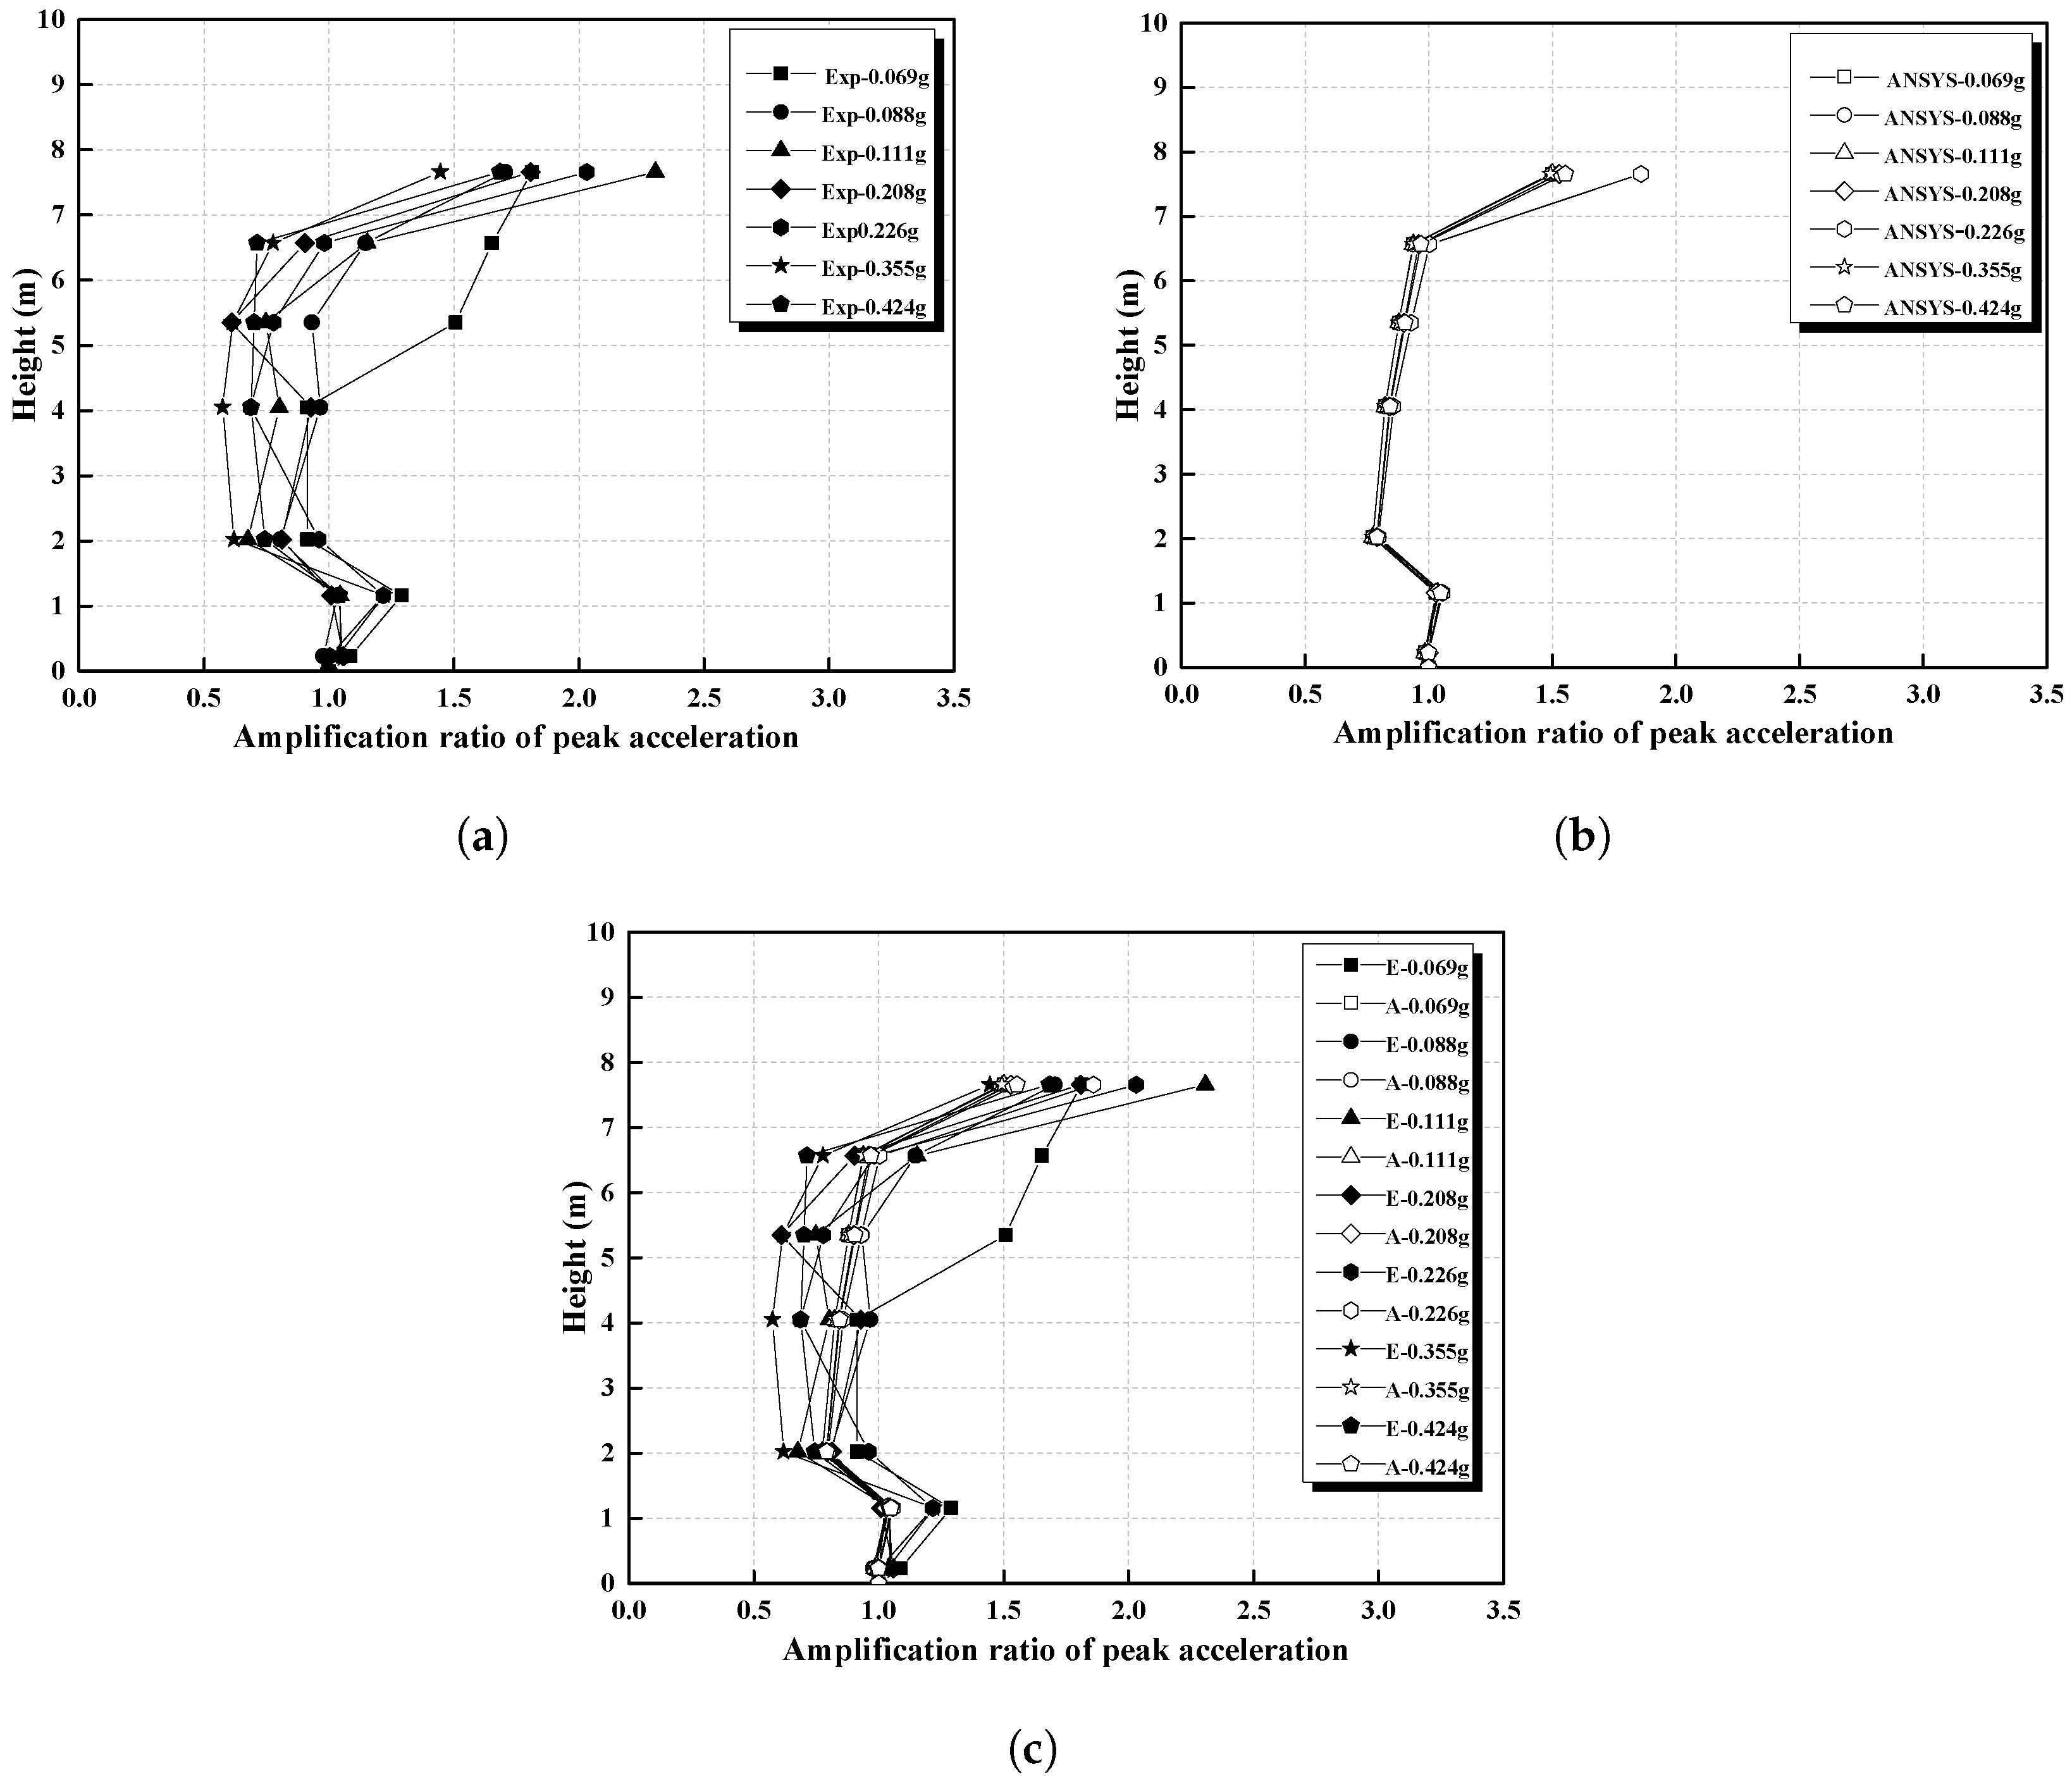
Figure 13 shows the amplification ratio results based on the finite element model and the peak acceleration determined from the centrifuge test. In the experimental results, the dynamic centrifuge test showed various amplification ratios, but the ANSYS Workbench model showed almost constant amplification. The amplification ratio of peak acceleration at different heights was standardized to a value ranging from 1 to more than 2. Afterward, the peak acceleration was amplified in the first body (2.02 m) and decreased in the second body (4.05 m), and it was observed that the acceleration was continuously amplified at a higher position.
Various factors can explain the variance in seismic behavior between the centrifuge tests and simulation modeling under the Ofunato earthquake data in terms of peak acceleration. First, the difference in conditions between experimental and simulation analysis should be taken into account. The material surface in the simulation model was smooth, and the connection was specified by the same coefficient, whereas the material surface of the experimental sample was rough and not completely consistent across all structures. The model was built with solid parts, while the stone composition was not completely dense and included voids.
The dynamic centrifuge experiment was conducted incrementally on a single specimen, increasing from minimum to maximum acceleration values. In a stone structure construction, the outcome of one step may be impacted by the vibration of a preceding step. As ground motion data were gradually added, an independent analysis of the seismic performance in the simulation model was performed. At greater acceleration levels, this unique methodology can provide different outcomes.
There were no breakaway or falling stone pieces when the peak acceleration ground motion was increased to 0.4 g. The maximum design acceleration was 0.22 g (2400 year), in comparison to the Korean seismic design guide. As with the dynamic centrifuge test, the stone pagoda sample was shaken and vibrated under various ground motion records, although no slipping or collapse of stone layers occurred. Based on the results, the stone pagoda exhibited a good seismic response under the effect of earthquake motion. A comparison of the results of centrifuge testing with those of finite element analysis shows overall agreement, with small and acceptable differences.
5.3. Acceleration vs. Time Relationship and Frequency Response
Figure 14a describes the relationship between acceleration and time after analyzing the simulation modeling, and frequency response is shown in
Figure 14b. The frequency value was investigated and calculated by transferring from acquired acceleration. The acceleration in the time domain signal was accumulated at the ground surface; the lower stylobate; the upper stylobate; and the first, second, third, fourth, and fifth floor bodies. In general, the acceleration-versus-time spectrum at different heights had the same objective. Additionally, it is apparent that the repetition of the frequency response in the modeling was maintained. The greatest frequency value was estimated to be 4.76 Hz.
Using sweeping pulses to excite antennae, the dynamic centrifuge test indirectly determined the natural frequency. The scaled model of the earthquake simulator has an excitation frequency of 30 to 300 Hz, which is comparable to the 2–20 Hz range for the prototype. The frequency domain was converted from the measured acceleration value and estimated to have a maximum value of 2.13 Hz, in addition to showing a propensity to amplify, even at 4 Hz. Although it is difficult, comparing frequencies between the centrifuge test and simulation analysis is crucial for predicting the behavior of the structure.
6. Conclusions
To examine the reliability of the seismic analysis conducted using the finite element method, the seismic performance of the five-story stone pagoda at Jeongnimsa Temple site was evaluated through finite element modeling and confirmed with dynamic centrifuge test results. The following conclusions can be drawn based on the obtained results:
1. The natural frequency of the five-story stone pagoda at Jeongnimsa temple site was measured to be 4.5 Hz. It was measured to have a lower natural frequency than other stone pagodas of similar size, which we attribute to the lack of previous history of repair or reinforcement. As a result of eigenvalue analysis assuming the target structure to have 29 degrees of freedom, the shear stiffness of the stone contact area was measured to be 99,000 kg/m.
2. To examine the reliability of the Pagoda finite element model, the seismic performance was evaluated using a 3D finite element model of the the five-story stone pagoda at Jeongnimsa Temple site and confirmed by dynamic centrifuge testing results. The experimental data had a higher peak acceleration than the data obtained in the simulation study, with a margin of difference of around 13%. Considering the experimental settings, simulation analysis, and the mathematical procedure of the experimental machine and analytical software, this variation can be regarded as acceptable. The peak acceleration amplification ratio at different heights was standardized, with values ranging from 1 to over 2.
3. The acceleration continued to increase after being amplified in the upper base stylobates (1.16 m), then decreased again in the first-floor body (2.02 m). This methodology might be utilized to evaluate dynamic centrifuge test findings and to compare seismic performance in testing and analytical work based on the simulation analysis results. Furthermore, structural behavior can be predicted using the simulation analyses of other similar stone structures and earthquake ground motion in Korea and other nations.
In this study, other factors, including failure mechanism, damage distribution, non-linear deformation, and the interaction of the soil and structures, were not taken into account. These reactions of masonry stone pagodas can be evaluated in future investigations, particularly under seismic ground motion conditions. The results of the analysis presented herein can be used to preserve and repair invaluable cultural heritages sites, particularly under the action of seismic ground motion.
Author Contributions
Conceptualization, G.L. and K.L.; Methodology, H.-J.P., K.V.A.P., J.-Y.K. and S.-M.L.; Software, G.L.; Writing—original draft, G.L.; Writing—review and editing, G.L. All authors have read and agreed to the published version of the manuscript.
Funding
This research was funded by the Basic Science Research Program through the National Research Foundation of Korea (NRF) funded by the Ministry of Education (NRF-2022R1I1A1A01065372) and Ministry of Land, Infrastructure and Transport of Korean Government (RS-2021-KA161540).
Institutional Review Board Statement
Not applicable.
Informed Consent Statement
Not applicable.
Data Availability Statement
Not applicable.
Acknowledgments
Authors thank the support by the Basic Science Research Program through 369 the National Research Foundation of Korea (NRF) funded by the Ministry of Education (NRF- 370 2022R1I1A1A01065372) and Ministry of Land, Infrastructure and Transport of Korean Government 371 (RS-2021-KA161540).
Conflicts of Interest
The authors declare no conflict of interest.
References
- Lee, G.; Park, J.H.; Lee, C.H.; Lee, S.M.; Lee, K. Mechanical and Structural Investigation of Traditional Masonry Systems with Diverse Types of Bricks and Hydrated Lime Mortars. Int. J. Archit. Herit. 2023, 1–23. [Google Scholar] [CrossRef]
- Hong, N.K.; Hong, S.G. Parametric Simulation of Multi-level Rigid Blocks under Horizontal Excitations. In Proceedings of the 16th World Conference on Earthquake Engineering, Santiago, Chile, 9–13 January 2017; Volume 4594. [Google Scholar]
- Betti, M.; Galano, L.; Vignoli, A. Time-history seismic analysis of masonry buildings: A comparison between two non-linear modelling approaches. Buildings 2015, 5, 597–621. [Google Scholar] [CrossRef]
- Hansapinyo, C. Seismic Performances of Brick Masonry Inverted Bell-shaped Chedi. APCBEE Procedia 2014, 9, 217–221. [Google Scholar] [CrossRef]
- Kim, D.S.; Kim, N.R.; Choo, Y.W.; Cho, G.C. A newly developed state-of-the-art geotechnical centrifuge in Korea. KSCE J. Civ. Eng. 2013, 17, 77–84. [Google Scholar] [CrossRef]
- Yurdakul, M.; Yılmaz, F.; Artar, M.; Can, Ö.; Öner, E.; Daloğlu, A.T. Investigation of time-history response of a historical masonry minaret under seismic loads. Structures 2021, 30, 265–276. [Google Scholar] [CrossRef]
- Lu, J.; Han, X.; Wang, Z.; Li, C. Research on Dynamic Properties of Ancient Masonry Pagoda with Solid Structure in China. Int. J. Archit. Herit. 2022, 16, 746–766. [Google Scholar] [CrossRef]
- Bocciarelli, M.; Barbieri, G. A numerical procedure for the pushover analysis of masonry towers. Soil Dyn. Earthq. Eng. 2017, 93, 162–171. [Google Scholar] [CrossRef]
- Zhang, G.; Sun, Z.; Ding, M.; Zhao, Z.; Gao, Y. Field test and emergency reinforcement evaluation for an ancient wood pagoda. Struct. Des. Tall Spec. Build. 2020, 29, e1686. [Google Scholar] [CrossRef]
- Endo, Y.; Hanazato, T. Seismic Analysis of a Three-Tiered Pagoda Temple Affected by the 2015 Gorkha Earthquake. Int. J. Archit. Herit. 2020, 14, 457–470. [Google Scholar] [CrossRef]
- Kim, H.-S.; Kim, D.-K.; Won, T.-H.; Jeon, G.W. Seismic Behavior Characteristics of Stone Pagoda According to Contact Surface Types. J. Korean Assoc. Spat. Struct. 2019, 19, 41–50. [Google Scholar] [CrossRef]
- Genç, A.F.; Ergün, M.; Günaydin, M.; Altunişik, A.C.; Ateş, Ş.; Okur, F.Y.; Mosallam, A.S. Dynamic analyses of experimentally-updated FE model of historical masonry clock towers using site-specific seismic characteristics and scaling parameters according to the 2018 Turkey building earthquake code. Eng. Fail. Anal. 2019, 105, 402–426. [Google Scholar] [CrossRef]
- Kim, J.K.; Ryu, H. Seismic test of a full-scale model of a five-storey stone pagoda. Earthq. Eng. Struct. Dyn. 2003, 32, 731–750. [Google Scholar]
- Park, H.J.; Kim, D.S. Centrifuge modelling for evaluation of seismic behaviour of stone masonry structure. Soil Dyn. Earthq. Eng. 2013, 53, 187–195. [Google Scholar] [CrossRef]
- Park, H.J.; Kim, D.S.; Choo, Y.W. Evaluation of the seismic response of stone pagodas using centrifuge model tests. Bull. Earthq. Eng. 2014, 12, 2583–2606. [Google Scholar] [CrossRef]
- Baker, J.W. Measuring bias in structural response caused by ground motion scaling. In Proceedings of the 8th Pacific Conference on Earthquake Engineering, Singapore, 5–7 December 2007; pp. 1–6. [Google Scholar]
- Lee, S.; Park, H.; Kim, S.; Lee, S. Change of Dynamic Characteristics of Stone Masonry Structures According to the Number of Layers of Granite Brick. J. Archit. Inst. Korea 2001, 17, 3–10. [Google Scholar]
- Jaishi, B.; Ren, W.X.; Zong, Z.H.; Maskey, P.N. Dynamic and seismic performance of old multi-tiered temples in Nepal. Eng. Struct. 2003, 25, 1827–1839. [Google Scholar] [CrossRef]
- Lu, J.; Zhang, C.; Wang, Z.; Han, X. Dynamic performance and seismic damage analysis of an ancient masonry pagoda. J. Asian Archit. Build. Eng. 2022, 21, 2009–2026. [Google Scholar] [CrossRef]
- Yuan, J.; Fan, H.; Chen, H.-B.; Yao, L.; Abruzzese, D. Experimental Study of Dynamic Behaviour of Huqiu Pagoda. J. Eng. Mech. 2005, 22, 158–164. [Google Scholar]
- Chen, T.C.; Deng, H.; Luo, X.H. Dynamic characteristics analysis and test for Jinaozhou Pagoda. Zhendong Yu Chongji (J. Vib. Shock) 2010, 29, 193–196. [Google Scholar]
- Hong, S.i.; Kim, H.S. Analysis Method for Masonry Stone Pagoda using Discrete Element Method. J. Archit. Inst. Korea 2007, 23, 43–50. [Google Scholar]
- Pham, K.V.; Hong, S.G.; Lee, S.M.; Park, H.J.; Lee, K. Assessment of Seismic Performance of Three-Story Masonry Stone Pagoda by Dynamic Centrifuge Test and Simulation Analysis. Int. J. Archit. Herit. 2019, 15, 1213–1226. [Google Scholar] [CrossRef]
- Kim, H.S.; Kim, D.K.; Jeon, G.W. Seismic analysis and performance for stone pagoda structure under Gyeongju earthquake in Korea. Earthq. Struct. 2021, 21, 531–549. [Google Scholar] [CrossRef]
- Wikipedia. Wikipedia: Five-Story Stone Pagoda at Jeongnimsa Temple Site, Buyeo. Available online: https://en.wikipedia.org/wiki/ (accessed on 1 July 2023).
- Lee, S.-M.; Lee, K.-H.; Park, S.-W.; Suh, M.-C.; Lee, C.H. Computational Modelling Method by Using the Natural Frequencies of Five-Story Stone Pagoda in Chongnimsa Site. J. Korean Assoc. Spat. Struct. 2008, 8, 67–74. [Google Scholar]
- Lee, S.M.; Choi, H.S.; Lee, K.H.; Lee, C.H.; Jo, Y.H. Study on the Joint Stiffness, Natural Frequency and Damping Ratio of Stone Pagodas in Korea. J. Korean Assoc. Spat. Struct. 2018, 18, 45–53. [Google Scholar] [CrossRef]
- Martišek, D. Joint Rock Coefficient Estimation Based on Hausdorff Dimension. Adv. Pure Math. 2017, 7, 615–640. [Google Scholar] [CrossRef]
- Barton, N. Shear strength criteria for rock, rock joints, rockfill and rock masses: Problems and some solutions. J. Rock Mech. Geotech. Eng. 2013, 5, 249–261. [Google Scholar] [CrossRef]
- Yamashita, T.; Ohnaka, M. Nucleation process of unstable rupture in the brittle regime: A theoretical approach based on experimentally inferred relations. J. Geophys. Res. Solid Earth 1991, 96, 8351–8367. [Google Scholar] [CrossRef]
- Schofield, A.N. Cambridge Geotechnical Centrifuge Operations. Geotechnique 1980, 30, 227–268. [Google Scholar] [CrossRef]
- Taylor, R. Geotechnical Centrifuge Technology; CRC Press: Boca Raton, FL, USA, 2005. [Google Scholar]
- Lee, C.H.; Kim, Y.T.; Lee, M.S. Provenance Presumption for Rock Properties of the Five Storied Stone Pagoda in the Jeongrimsaji Temple Site, Buyeo, Korea. J. Geol. Soc. Korea 2007, 43, 183–196. [Google Scholar]
- NRICH (National Research Institute of Cultural Heritage). Buyeo Jeongnimsa Temple Site Maintenance and Restoration Historical Certificate Basic Investigation; Technical Report; National Research Institute of Cultural Heritage: Daejeon, Republic of Korea, 2009. [Google Scholar]
- ANSYS Inc. ANSYS Mechanical Theory Reference: Release 19.2; ANSYS Inc.: Canonsburg, PA, USA, 2018. [Google Scholar]
Figure 1.
Location of the five-story stone pagoda at Jeongnimsa temple site.
Figure 1.
Location of the five-story stone pagoda at Jeongnimsa temple site.
Figure 2.
Excitation and dynamic measurement of vibration.
Figure 2.
Excitation and dynamic measurement of vibration.
Figure 3.
Dynamic results for the five-story stone pagoda at Jeongnimsa temple site. (a) Time domain. (b) Frequency domain.
Figure 3.
Dynamic results for the five-story stone pagoda at Jeongnimsa temple site. (a) Time domain. (b) Frequency domain.
Figure 4.
Multiple-degrees-of-freedom shear vibration model.
Figure 4.
Multiple-degrees-of-freedom shear vibration model.
Figure 5.
Manufacturing procedure of the masonry stone pagoda model. (a) Assembling the pagoda stones. (b) Building and setting up the model in a container. (c) Model in the container and centrifuge simulator.
Figure 5.
Manufacturing procedure of the masonry stone pagoda model. (a) Assembling the pagoda stones. (b) Building and setting up the model in a container. (c) Model in the container and centrifuge simulator.
Figure 6.
The Ofunato earthquake ground motion record. (a) Time domain. (b) Frequency domain.
Figure 6.
The Ofunato earthquake ground motion record. (a) Time domain. (b) Frequency domain.
Figure 7.
Measured peak acceleration positions.
Figure 7.
Measured peak acceleration positions.
Figure 8.
Process of analysis.
Figure 8.
Process of analysis.
Figure 9.
Natural frequency and mode shapes of the pagoda ANSYS analysis. (a) Frequency domain of the ANSYS analysis result. (b) Mode shape.
Figure 9.
Natural frequency and mode shapes of the pagoda ANSYS analysis. (a) Frequency domain of the ANSYS analysis result. (b) Mode shape.
Figure 10.
Peak acceleration for input ground motion from the experimental and simulation results. (a) Peak acceleration for each input from the ground motion experimental results. (b) Peak acceleration for each input ground motion from the simulation results. (c) Comparison of peak acceleration for each input from the ground motion results.
Figure 11.
Peak acceleration from the experimental and simulation results at 0.069–0.111 g. (a) PGA input motion of 0.069 g. (b) PGA input motion of 0.088 g (c) PGA input motion of 0.111 g.
Figure 11.
Peak acceleration from the experimental and simulation results at 0.069–0.111 g. (a) PGA input motion of 0.069 g. (b) PGA input motion of 0.088 g (c) PGA input motion of 0.111 g.
Figure 12.
Peak acceleration of experimental and simulation results at 0.208–0.424 g. (a) PGA input motion of 0.208 g. (b) PGA input motion of 0.226 g. (c) PGA input motion of 0.355 g. (d) PGA input motion of 0.424 g.
Figure 12.
Peak acceleration of experimental and simulation results at 0.208–0.424 g. (a) PGA input motion of 0.208 g. (b) PGA input motion of 0.226 g. (c) PGA input motion of 0.355 g. (d) PGA input motion of 0.424 g.
Figure 13.
Amplification ratios from experimental and simulation results. (a) Amplification ratio from experimental results. (b) Amplification ratio from simulation results. (c) Comparison of amplification ratio from experimental and simulation results.
Figure 13.
Amplification ratios from experimental and simulation results. (a) Amplification ratio from experimental results. (b) Amplification ratio from simulation results. (c) Comparison of amplification ratio from experimental and simulation results.
Figure 14.
Time domain signal and frequency response. (a) Time domain signal. (b) Frequency response.
Figure 14.
Time domain signal and frequency response. (a) Time domain signal. (b) Frequency response.
Table 1.
Characteristics of the five-story stone pagoda at Jeongnimsa temple site.
Table 1.
Characteristics of the five-story stone pagoda at Jeongnimsa temple site.
| Classification | National Treasure No. 9 (South Korea) |
| Type of Cultural Properties | Stone Pagoda |
| Location | 379, Dongnam-ri, Buyeo-eup, Buyeo-gun, Chungcheongnam-do |
| Age | Late Baekje Period |
Table 2.
Specifications of Blastmate III.
Table 2.
Specifications of Blastmate III.
| Measurement range | 0.127–254 mm/s |
| Frequency range | 2–300 Hz |
| Sample rate | 1024 to 16,384 sample/s per channel |
| Recording modes | Histogram and Instantel histogram combo |
| Recording interval | 2, 5, or 15 s; 1, 5, or 15 min |
| Operating temperature | −10 to 50 °C |
| Manufacturer | Blastmate Inc. of Canada |
Table 3.
Dynamic test results of the stone pagodas.
Table 3.
Dynamic test results of the stone pagodas.
| Name | Height (m) | Natural Frequency (Hz) | Joint Stiffness (kN/m) |
|---|
| Five-story stone pagoda at Jeongnimsa temple site | 8.9 | 4.5 | 99,000 |
| Five-story stone pagoda of Muryangsa temple | 7.4 | 13.0 | 267,000 |
| Three-story stone pagoda at Heungbeopsa temple site | 3.8 | 8.3 | 59,000 |
| Three-story stone pagoda at Seollimwon temple site | 4.7 | 5.3 | 80,000 |
| Seven-story stone pagoda in Tappyeong-ri, Chungju | 14.5 | 5.5 | 188,000 |
| Five-story stone pagoda at Bongeopsa temple site | 6 | 3.6 | 20,000 |
Table 4.
Scaling factor based on geotechnical centrifuge technology.
Table 4.
Scaling factor based on geotechnical centrifuge technology.
| Pagoda Prototype | Model Scale Ratio |
|---|
| Length, displacement | N |
| Dymamic acceleration (earthquake) | N |
| Gravity | N |
| Mass | N |
| Density | 1 |
| Stress, modulus | 1 |
| Strain | 1 |
| Diffusion time | N |
Table 5.
Prototype specifications and 1/15 scale model.
Table 5.
Prototype specifications and 1/15 scale model.
| Classification | Number of Stone Pieces |
|---|
| Roof stone | 5 |
| Body stone | 5 |
| Roof stone | 12 |
| Body stone | 4 |
| Roof stone | 12 |
| Body stone | 9 |
| Roof stone | 12 |
| Body stone | 8 |
| Roof stone | 12 |
| Body stone | 12 |
| Upper base stylobate | 8 |
| Middle of base stylobate | 16 |
| Lower base stylobate | 16 |
| Total | 131 |
| Size of prototype | Height 8.93 m, Width 4.99 m |
| Size of 1/15 model | Height 59.5 cm, Width 33.3 cm |
Table 6.
Material properties of Iksan Hwang-deung stone.
Table 6.
Material properties of Iksan Hwang-deung stone.
| | Density (ton/m) | Elastic Modulus (GPa) | Poisson’s Ratio | Shear Wave Velocity (m/s) |
|---|
| Hwang-deung
stone | 2.67 | 25 | 0.2 | 2.037 |
Table 7.
Variation in peak acceleration under the Ofunato earthquake.
Table 7.
Variation in peak acceleration under the Ofunato earthquake.
| | Peak Acceleration (g) |
|---|
| | 50 Year | 100 Year | 200 Year | 500 Year |
| | 0.069 g | 0.088 g | 0.111 g | 0.208 g |
| Height (m) | Exp. | ANSYS | Erorr | Exp. | ANSYS | Erorr | Exp. | ANSYS | Erorr | Exp. | ANSYS | Erorr |
| 7.66 | 0.125 | 0.104 | 17% | 0.15 | 0.132 | 12% | 0.256 | 0.167 | 35% | 0.376 | 0.318 | 15% |
| 6.57 | 0.114 | 0.065 | 43% | 0.101 | 0.083 | 18% | 0.128 | 0.104 | 19% | 0.188 | 0.200 | −6% |
| 5.35 | 0.104 | 0.061 | 42% | 0.082 | 0.077 | 6% | 0.083 | 0.098 | −18% | 0.127 | 0.187 | −47% |
| 4.05 | 0.063 | 0.057 | 10% | 0.085 | 0.072 | 15% | 0.089 | 0.091 | −3% | 0.193 | 0.175 | 9% |
| 2.02 | 0.063 | 0.053 | 15% | 0.071 | 0.068 | 4% | 0.075 | 0.086 | −15% | 0.169 | 0.164 | 3% |
| 1.16 | 0.089 | 0.071 | 20% | 0.091 | 0.091 | 0% | 0.116 | 0.115 | 1% | 0.21 | 0.214 | −2% |
| 0.23 | 0.075 | 0.068 | 9% | 0.086 | 0.087 | −1% | 0.116 | 0.109 | 6% | 0.22 | 0.208 | 5% |
| 0 | 0.069 | 0.069 | 0% | 0.088 | 0.088 | 0% | 0.111 | 0.111 | 0% | 0.208 | 0.208 | 0% |
| | Peak Acceleration (g) |
| | 1000 Year | 2400 Year | 2400 + Year | |
| | 0.226 g | 0.355 g | 0.424 g | |
| Height (m) | Exp. | ANSYS | Erorr | Exp. | ANSYS | Erorr | Exp. | ANSYS | Erorr | |
| 7.66 | 0.459 | 0.420 | 8% | 0.513 | 0.530 | −3% | 0.714 | 0.659 | 8% | |
| 6.57 | 0.222 | 0.227 | −2% | 0.276 | 0.333 | −20% | 0.302 | 0.411 | −36% | |
| 5.35 | 0.176 | 0.210 | −19% | 0.218 | 0.312 | −43% | 0.297 | 0.384 | −29% | |
| 4.05 | 0.155 | 0.194 | −25% | 0.204 | 0.292 | −43% | 0.292 | 0.358 | −23% | |
| 2.02 | 0.217 | 0.180 | 17% | 0.22 | 0.275 | −25% | 0.315 | 0.336 | −7% | |
| 1.16 | 0.275 | 0.239 | 13% | 0.433 | 0.370 | 15% | 0.442 | 0.445 | −1% | |
| 0.23 | 0.227 | 0.226 | 0% | 0.368 | 0.350 | 5% | 0.446 | 0.424 | 5% | |
| 0 | 0.226 | 0.226 | 0% | 0.355 | 0.355 | 0% | 0.424 | 0.424 | 0% | |
| Disclaimer/Publisher’s Note: The statements, opinions and data contained in all publications are solely those of the individual author(s) and contributor(s) and not of MDPI and/or the editor(s). MDPI and/or the editor(s) disclaim responsibility for any injury to people or property resulting from any ideas, methods, instructions or products referred to in the content. |
© 2023 by the authors. Licensee MDPI, Basel, Switzerland. This article is an open access article distributed under the terms and conditions of the Creative Commons Attribution (CC BY) license (https://creativecommons.org/licenses/by/4.0/).


 ,
, 


